Global Fishing Watch’s David Kroodsma on “dark” vessels

In our ongoing Conversations with the Coalition Q&A series, we are interviewing individual coalition participants about their work. We recently talked with David Kroodmsa, Chief Scientist, Global Fishing Watch, which recently became a Climate TRACE data contributor that is building an open-access picture of global fishing activity.
What drove your work to map the footprint of human activity at sea?
Global Fishing Watch was started on the idea that we really don't know what's happening across the ocean. Fishing has been plagued by illegal activity and opaque supply chains — a lot happens in the dark. That’s partly because very little is actually being monitored. According to our research, 75% of industrial fishing vessels are not publicly tracked. At the same time, the ocean is becoming increasingly industrialized, with more and more development of offshore energy taking place every year.
So in terms of visibility into all that activity, our understanding of what’s on land is far clearer than what is happening in the ocean. Think about what happens when you go to Google Maps, for starters. When you go to the satellite view, you can see every single building on the planet. But as soon as you pan over to the ocean, it becomes this pixelated nothingness — it's essentially unmapped. And that’s where we come in. We're filling in the map to understand things like: Where is the vessel traffic? Where are offshore structures popping up? Where is fishing taking place? And what are the emissions of these activities?
We believe the world needs a map to bring greater transparency to human activities at sea, cultivating accountability and helping inform governance decisions about the ocean. That’s why, together with partners at University of California, Santa Barbara, we built technology that we’re continually advancing to provide a snapshot of carbon emissions estimates in the world’s oceans.
What is your approach to collecting maritime emissions data?
The first thing we did was process vessel GPS data to create a global database of vessels in the world, and then we used machine learning to figure out which of them are fishing boats as well as when and where they are engaged in fishing. We augment this data with satellite imagery, which allows us to take pictures of all the boats that are not broadcasting their positions (because not all boats voluntarily say where they are).
With Climate TRACE, our goal is to fill in the data for vessels about which we have little information. OceanMind [a founding member of the coalition] has done a great job estimating emissions for large vessels, including shipping boats, which account for over half of the marine emissions. However, to model the emissions of these boats using GPS data, we need to know details about the vessel such as how big their engine is and their size. That information is lacking for hundreds of thousands of vessels that broadcast their GPS data. In addition, there are a few million smaller vessels, many of which are artisanal or small industrial fishing vessels, which do not broadcast their GPS positions, and we need another method to estimate emissions from these. This is particularly important for smaller and non-broadcasting vessels operating close to shore.
Based on how a vessel moves in the water, our model can help us estimate its size and type, its engine power, and its tonnage. With that, we can estimate how much fuel each boat used, and in turn, its emissions by voyage and by vessel. These emissions add up significantly when you consider these types of vessels alone emit a few hundred tons of carbon dioxide annually. Then, we can draw on satellite imagery — petabytes of radar and optical imagery — to detect vessels that do not have GPS and make estimates of their emissions based on their size and average activity.
What challenges are you facing now, and how might you solve them?
One challenge we’re tackling now is the fact that there are still many boats you don’t see at all with imagery. Those are even harder to estimate, so this year we're working to build out a model for those smallest of vessels. Overall we think there’s about 10% more emissions in the ocean not currently accounted for.
Another challenge is that the number of boats that broadcast their GPS positions has increased over time. So if you try to do a trend analysis with the common data sets, you might conclude that fishing is increasing. But the reality is that more fishing boats are equipped with Automatic Identification Systems (AIS) now, and fishing has actually declined over the past five years. You have to take a more holistic view to identify real-world trends.
How can these data inform emissions-reduction target setting, strategies, and measurement?
By accessing this actionable information — which is available publicly, and for free — virtually anyone can gain deep insight into how boats behave, and how that affects emissions.
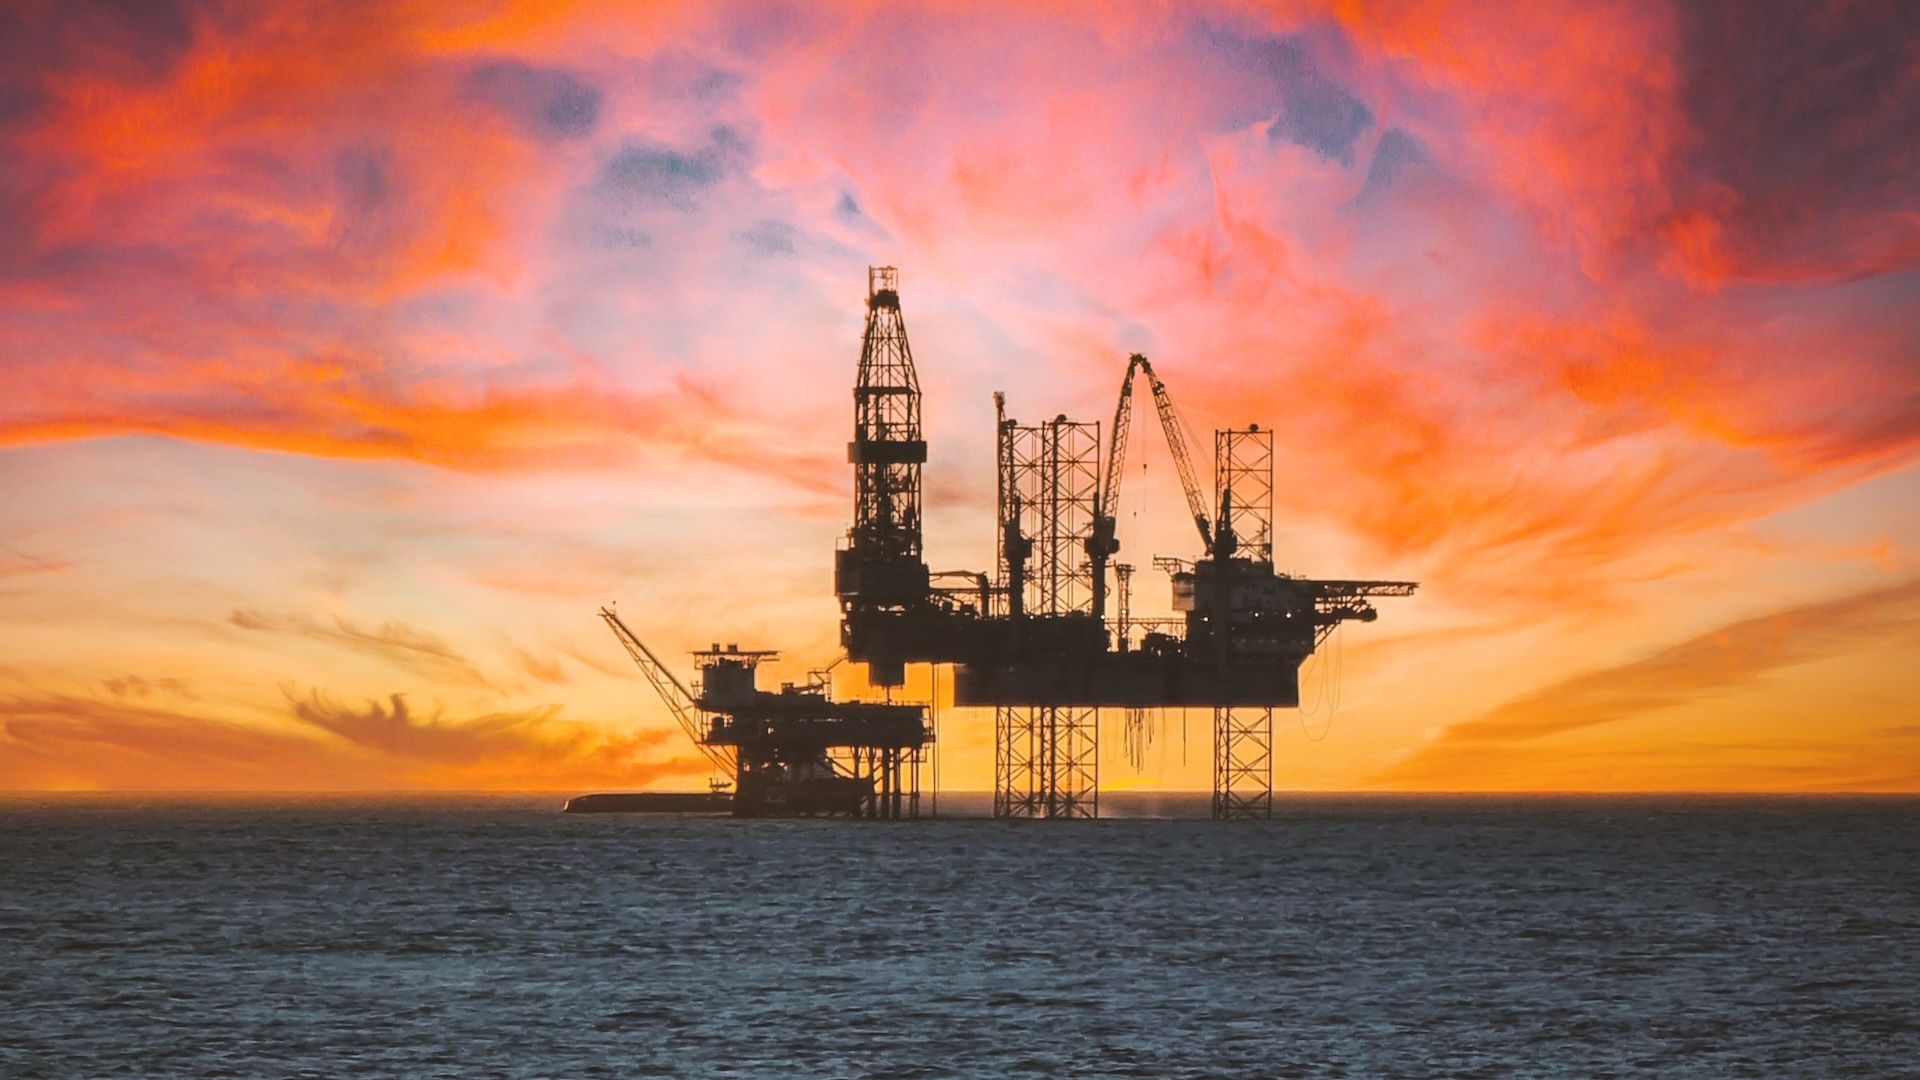
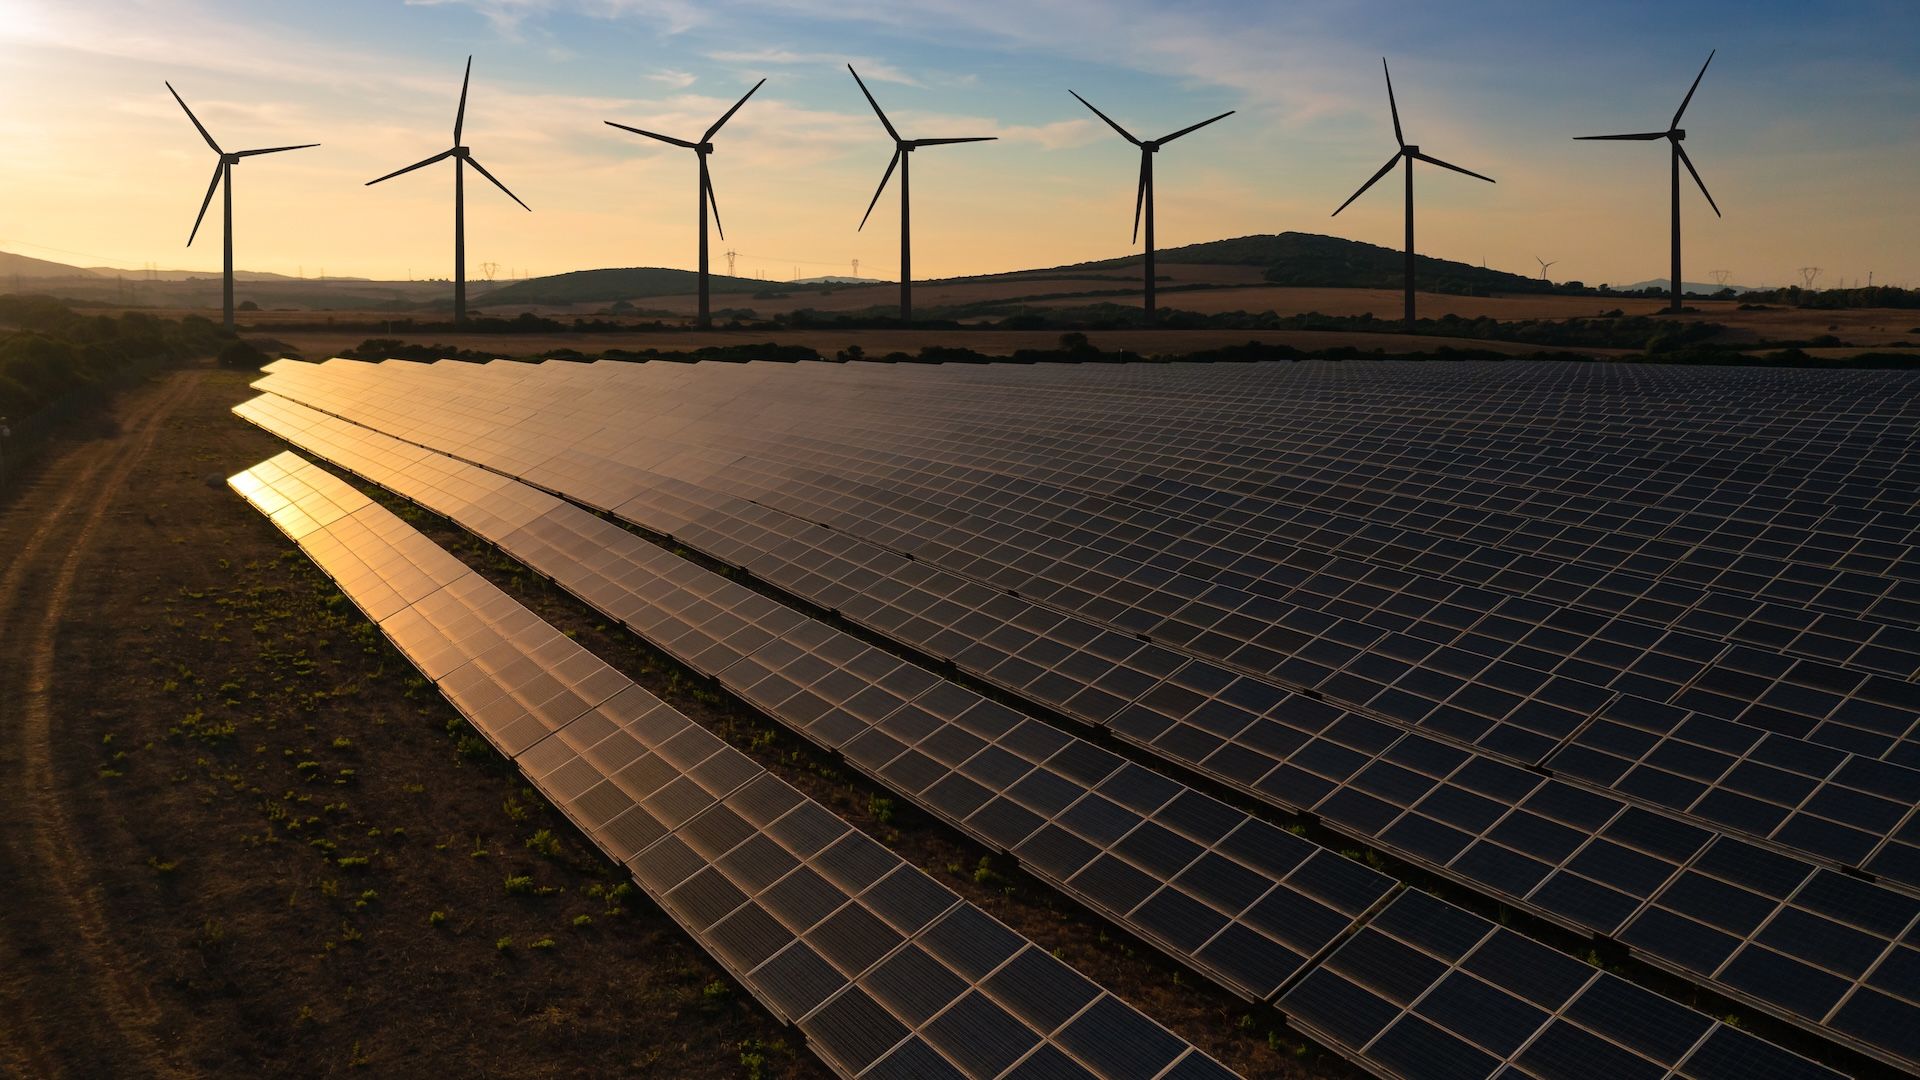
Supply chain leaders and corporate buyers, for starters, can use the data to select shipping based on lower carbon emissions — helping contribute to a cleaner supply chain. Researchers can use the data to, say, model how fleets will respond to a proposed carbon tax, or estimate the impacts of carbon leakage, which in turn can inform government and policy makers. Industry leaders, corporate buyers, and policymakers can look for insight on subsector activity, like shipping related to farmed fisheries. And, thanks to collaboration with RMI, they can map out the emissions of boats visiting oil platforms, and compare that with data from those that visit wind turbines.
Overall, access to this data can open up a powerful new understanding of vessel emissions — and in turn inform how we design our policies to reduce them. The ocean is after all the world’s largest public resource; we all have a stake in this.
Interviewed by Daisy Simmons.