If you’re using Climate TRACE data for an emissions reduction project, policy, or research paper, we’d love to know more! We occasionally feature highly impactful projects on our website and in our newsletter. Please contact us.
Examples and Case Studies
Scope 2 and 3 emission reduction
What is it? Scope 2 emissions are generated from the use of electricity, and Scope 3 emissions are all indirect emissions from upstream and downstream activities that occur outside the facility in question. For example, at an automobile manufacturing unit, any electrified processes are considered to be Scope 2 emissions and the steel used in manufacturing the automobiles are considered to be Scope 3 emissions. Reducing Scope 2 and Scope 3 emissions pose a different challenge because asset owners often have no direct control over the power plant or the steel plant. These case studies highlight how corporate procurement can reduce their emissions by prioritizing impact.
Why it matters Corporate procurement of renewable energy is a very important tool for funding new renewable capacity. 40% of new U.S. clean energy capacity additions were corporate-driven and 83% of all signed PPAs in Europe were driven by corporate procurement. However, this deployment of renewables globally is uneven and dependent on the availability of funding and demand for large-scale projects. While building renewables anywhere in the world can reduce emissions, renewable investors have a limited budget and look for ways to maximize the impact of their investment. One way renewable investors can do this is by building renewable energy in the most emissions-intensive and coal-dominated grids.
Similarly, corporate procurement can drive decarbonization by procuring lower-emission raw materials which can be a powerful market signal to their suppliers to invest in green processes.
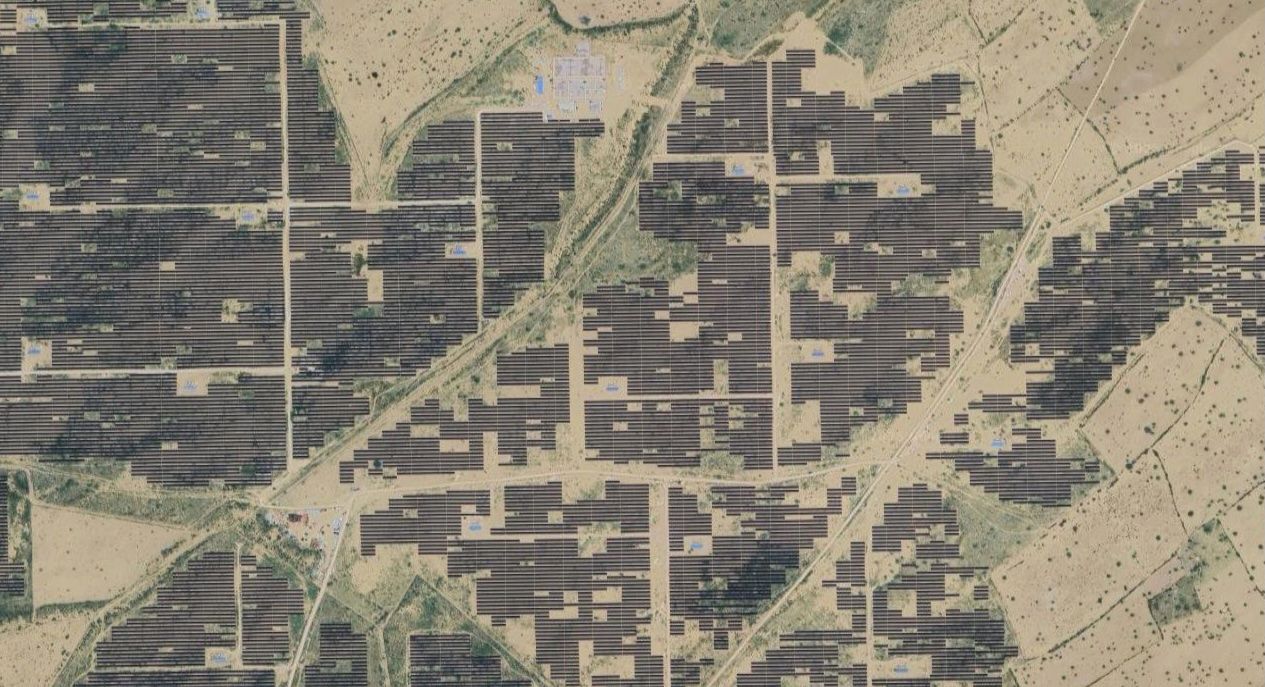
How it works Climate TRACE analysis shows that by building renewables in emissions-intensive grids, projects can avoid up to three times as much GHG emissions compared with building projects in places where there is already a lot of renewable energy on the grid. That’s because building more clean energy in places where there's already a lot of that kind of renewable generation just competes with other clean energy. A better approach is to build new clean energy on dirtier grids, where wind and solar displace greater amounts of fossil-fueled power generation.
Similarly, companies can reduce the emissions impact from their supply chain by 2 - 4x, particularly in materials like steel and aluminum by procuring their material from a supplier that has invested in efficient and electrified manufacturing processes.
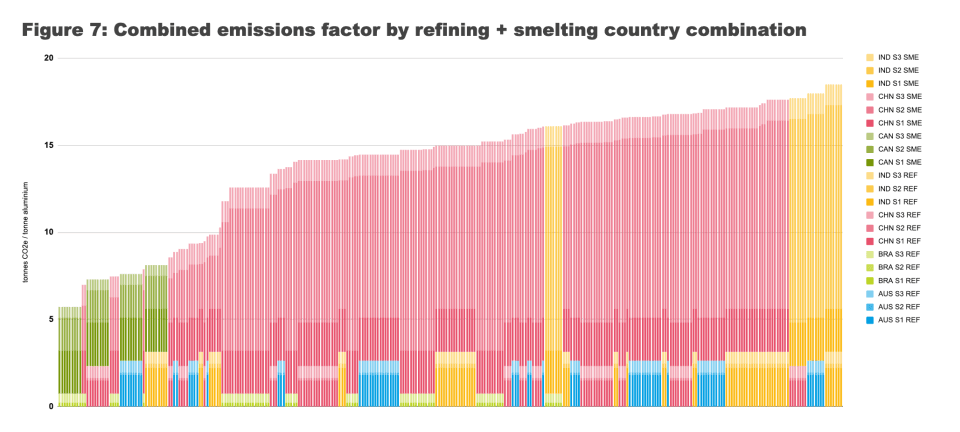
Granular, facility-level emissions intensities of production facilities allows aluminum buyers to understand the emissions impact of their supply chain and optimize for emission reduction.