Getting A Clearer Picture Of Emissions From Major Oil And Gas Countries
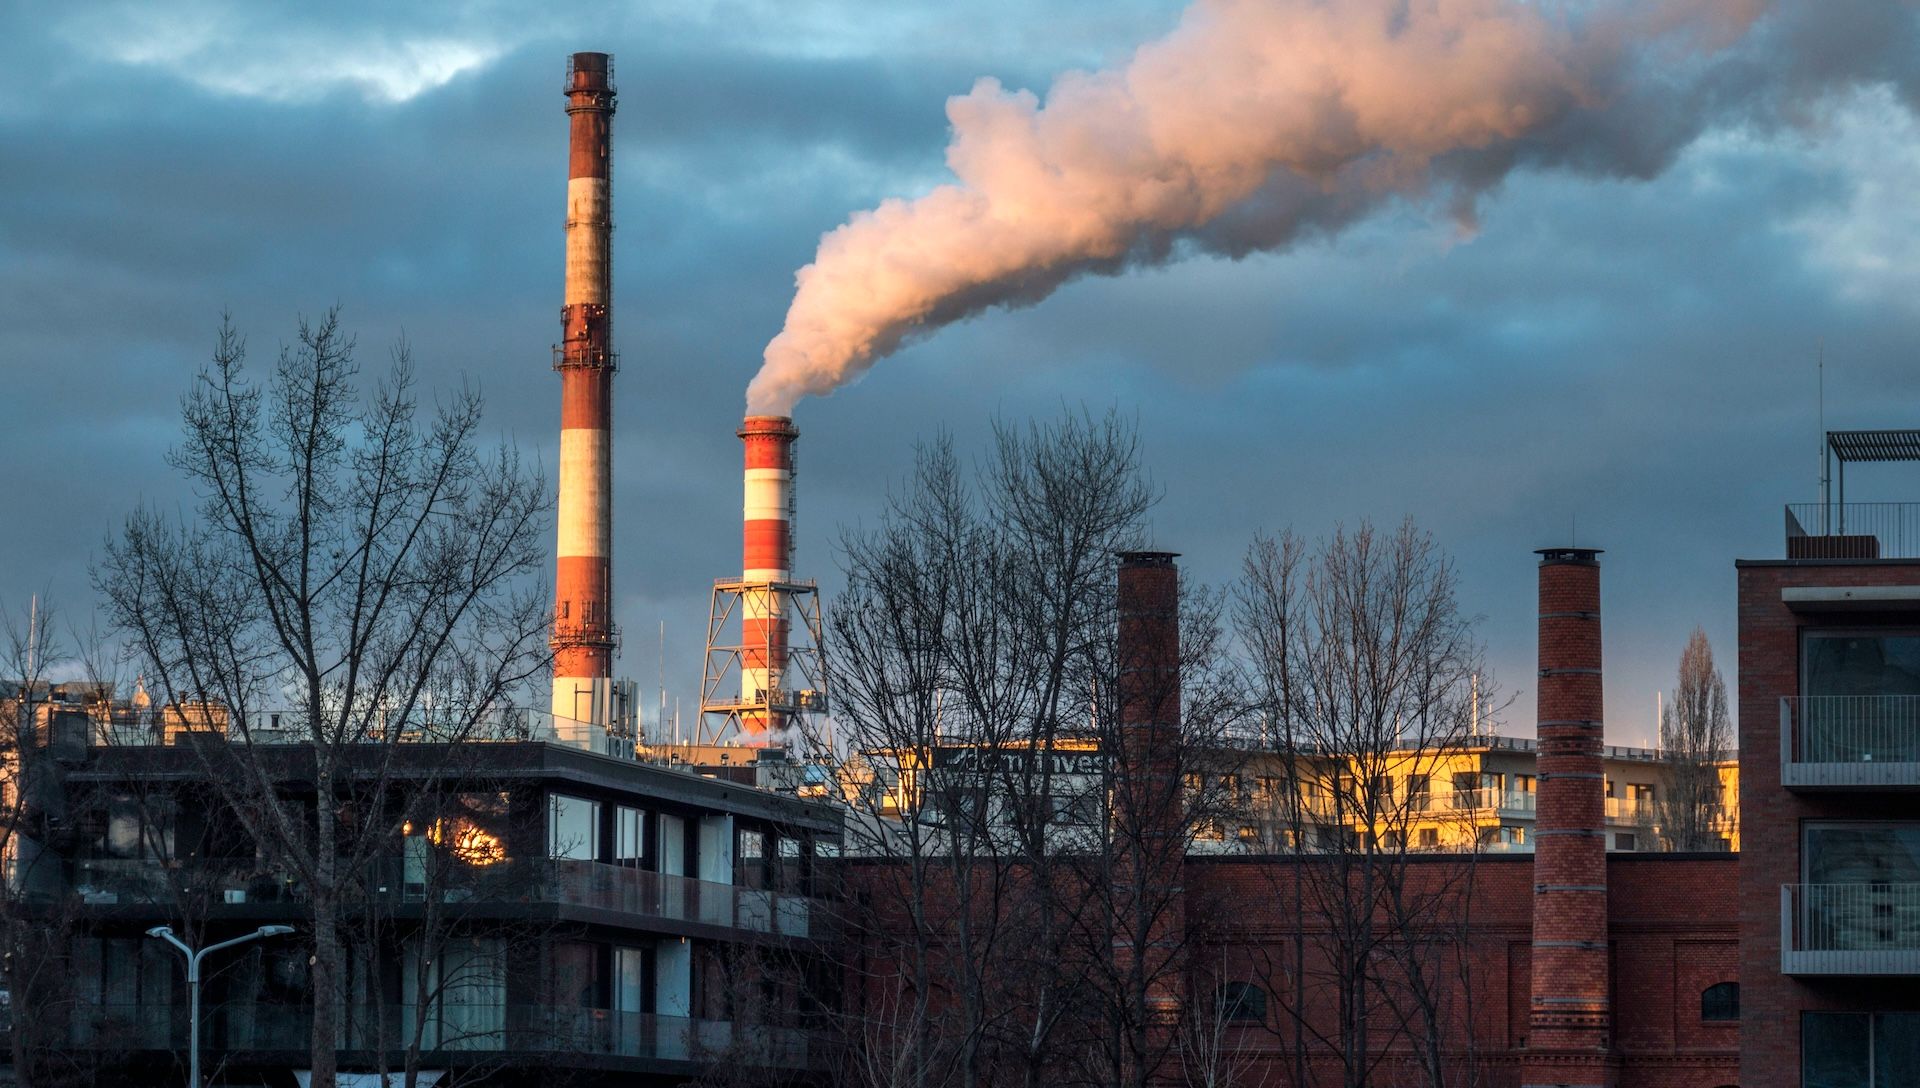
The oil and gas sector is responsible for a large share of human-made greenhouse gas (GHG) emissions: Climate TRACE data shows that more than 11 percent of emissions come from the production and refining of oil and gas. And that portion is before the refined products fan out across the global economy and generate massive, additional climate footprints from the combustion of those fossil fuels. When we focus primarily on the emissions associated with the burning of fossil fuels, we overlook the significant upstream emissions in their supply chain.
This critical sector has historically been too opaque, making it difficult to mitigate its emissions. Through participation in Climate TRACE, RMI is helping to make emissions from the global oil and gas sector visible. Using open-source models to generate more timely, accurate, and comprehensive emissions information via the TRACE platform, we highlight new insights about the emissions from oil and gas.
Insight 1: 15 countries account for over 70 percent of all emissions in production and refining.
The path to global decarbonization starts with knowing where emissions are coming from. Just 15 countries account for the lion’s share of oil and gas sector emissions. Several countries, including the United States and Russia, pollute doubly, emitting massive amounts of GHGs from both production and refining. Others are top emitters in terms of production or refining individually, but not both (see Figure 1).
Each country can focus its GHG reduction strategies on where it emits most (production, refining, or both). This will be critical when it comes to tracing and reducing emissions from oil and gas supply chains.
Insight 2: Self-reporting today is wholly inadequate — many top oil and gas emitters don’t even track their emissions.
In oil and gas production and refining, among the world’s top countries that submit regular inventories, emissions from oil and gas may collectively be around double (1 billion tons higher than) recent UNFCCC reports. Further, it is likely that over 1 billion additional tons CO2e per year — more than the annual emissions of the 100 lowest-ranking emitting countries combined — have gone uncounted by countries that aren’t required to report their oil and gas emissions regularly.
This is, in part, a result of haphazard accounting and convoluted reporting in current inventories. For example, several high-emitting oil and gas operations, such as surface processing, hydrogen production, and catalyst regeneration, are not reported uniformly in country inventories. This leads to missing or hidden emissions.
Furthermore, reporting requirements vary among different countries due to historic UNFCCC designations, resulting in inadequate country assessments of global oil and gas emissions. Some countries (Annex 1) typically submit regular inventories on a two-year delay. Other countries (non-Annex 1) are not subject to the same guidelines and do not report regularly. This hodgepodge approach makes it difficult to carefully track emissions trajectories and obtain up-to-date information needed to make informed climate decisions. Of the top countries for global oil and gas production and refining, fewer than half are required to regularly inventory and report sector-specific emissions (see Figure 2). Overall, emissions are poorly accounted for in this large, intensive sector.
Insight 3: Drilling down to the level of oil and gas assets and operations reveals further opportunities to reduce emissions.
While quantifying and differentiating country-level emissions is critical, expanding transparency beyond national data reveals new opportunities to slash GHG emissions. Even within a country, the climate intensity of oil and gas can vary markedly. In the United States, for example, a barrel of heavy oil from California can be 10 times dirtier than a barrel of low-leak light oil from Texas. The same holds true for gas. But this emissions gap can be significantly narrowed through available operational improvements.
Greater visibility on oil and gas assets and operations offers insights that countries can use to submit more accurate emissions inventories and climate pledges. With this climate intelligence, we can also quickly cut oil and gas sector emissions as we strive to meet global climate and sustainable development goals.
SO WHAT?
To chart a clean energy transition, we must bring transparency to emissions-intensive sectors like oil and gas. For production and refining, the Climate TRACE platform bolsters accountability that is currently lacking when countries self-report their emissions. This data also offers all countries access to reliable, accurate, and timely emissions data across all sectors of their economies.
We encourage you to dig deeper into the TRACE tool, and we welcome data providers to join our coalition to help drive continuous improvement and provide more granularity. Learn more at https://www.climatetrace.org/.
Deborah Gordon is a Senior Principal in the Climate Intelligence Program at coalition member RMI. Frances (Fran) Reuland is an Associate with RMI’s Climate Intelligence Program where she is part of the Oil and Gas Solutions initiative.


