Country Spotlight: India
Overview
India is the third-largest emitter of greenhouse gases globally. With a population of almost 1.4 billion people, many of whom are still without access to electricity and clean cooking fuels. In addition, agriculture is the largest source of livelihoods in the country and is the home of the world’s second largest cattle population. Consequently, India remains a strong proponent of the Paris Agreement principle of “common but differentiated responsibilities.”
India’s Nationally Determined Contributions under Paris did not set an absolute GHG reduction target, but focused on other goals such as reducing emissions intensity, increasing renewable energy resources, and creating carbon sinks. Prime Minister Narendra Modi says India is not only on-track to meet India’s pledges under the Paris agreement but is ahead of schedule. Climate Action Tracker, however, rates India’s mitigation targets as ‘highly insufficient’ and no updated NDC has been submitted to the UNFCCC to date.
By the numbers
As the third-largest global GHG emitter, India accounted for just over 7% (22 billion tonnes CO2e) of emissions during the period 2015–2020, excluding land use change. Since adopting the Paris Agreement, India’s emissions have continued to grow at an average rate of 1.8% — with the exception of 2020, when emissions-causing activities were likely affected due to COVID-related lockdowns.
Two sectors — energy and manufacturing — are responsible for over half of the country’s emissions. India is also ranked #1 in emissions related to agriculture, representing 13% of total global emissions for 2015–2020.
How It Compares
The latest available official GHG inventory for the country is from 2016, as part of the Biennial Update Report submitted to the UNFCCC in February 2021. Even excluding land use change, there is a significant difference between Climate TRACE data and India’s official report, with the official estimate about 25% lower than the Climate TRACE data.
Of these, the agriculture and waste sectors show the largest differences, with Climate TRACE numbers double and quadruple the official estimates, respectively. For agriculture, although Climate TRACE estimates for 2016 use FAOSTAT data, it should be noted that for the rice and agricultural soils subsectors, Climate TRACE estimates for 2020 are in closer agreement with FAOSTAT than with the official inventory. It should also be noted that India’s BUR also reports high rates of uncertainty with its agricultural sector estimates, like many other countries.
Data Highlights
RICE CULTIVATION
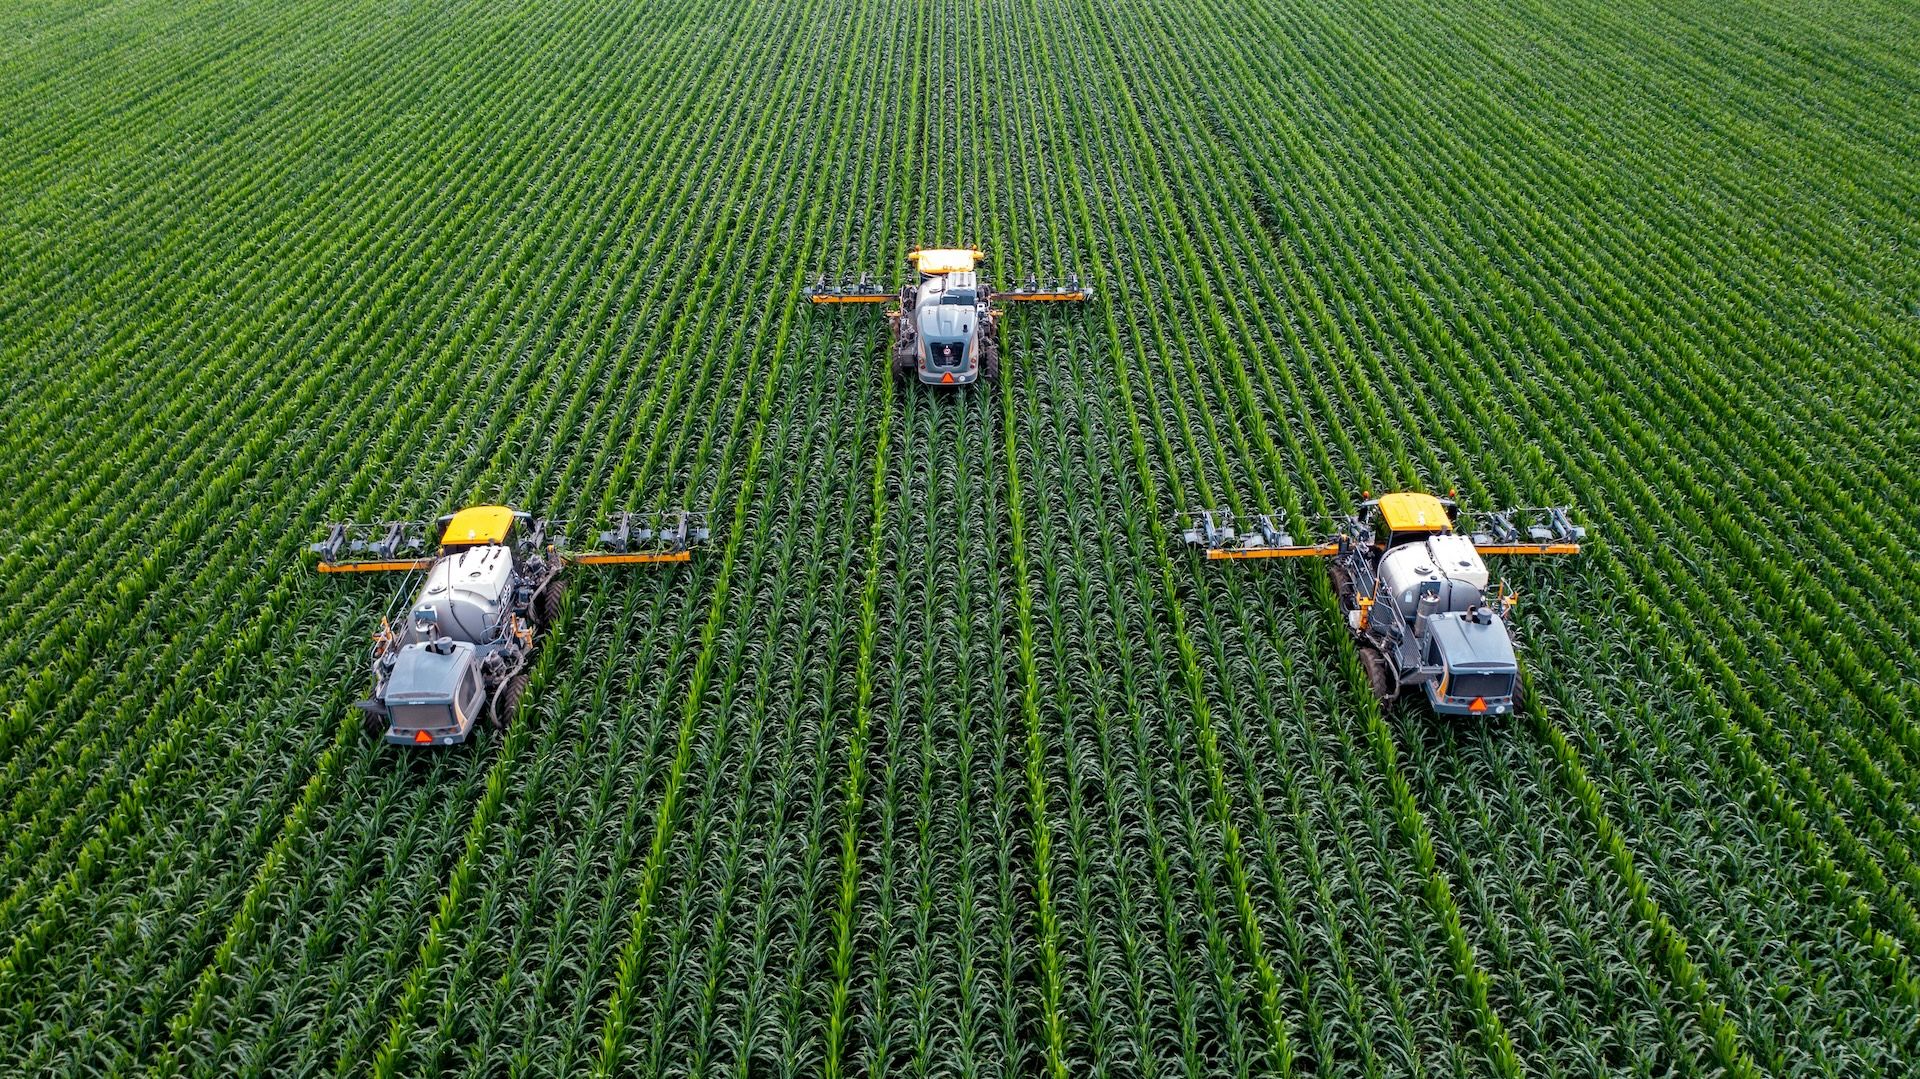
For rice cultivation in India, Climate TRACE uses satellite-driven estimates. In 2020, rice cultivation emissions from India were the highest in the world (contributing to 27.7% of global emissions from the sector). Climate TRACE data is also three times higher than the estimate from the 2016 inventory. Similarly, FAOSTAT data for 2016 estimates emissions to be nearly double the official estimate. In addition, another undercounted source of emissions are cropland fires, which in India are mostly rice stubble, so the actual emissions impact of rice overall is likely higher than understood.
POWER
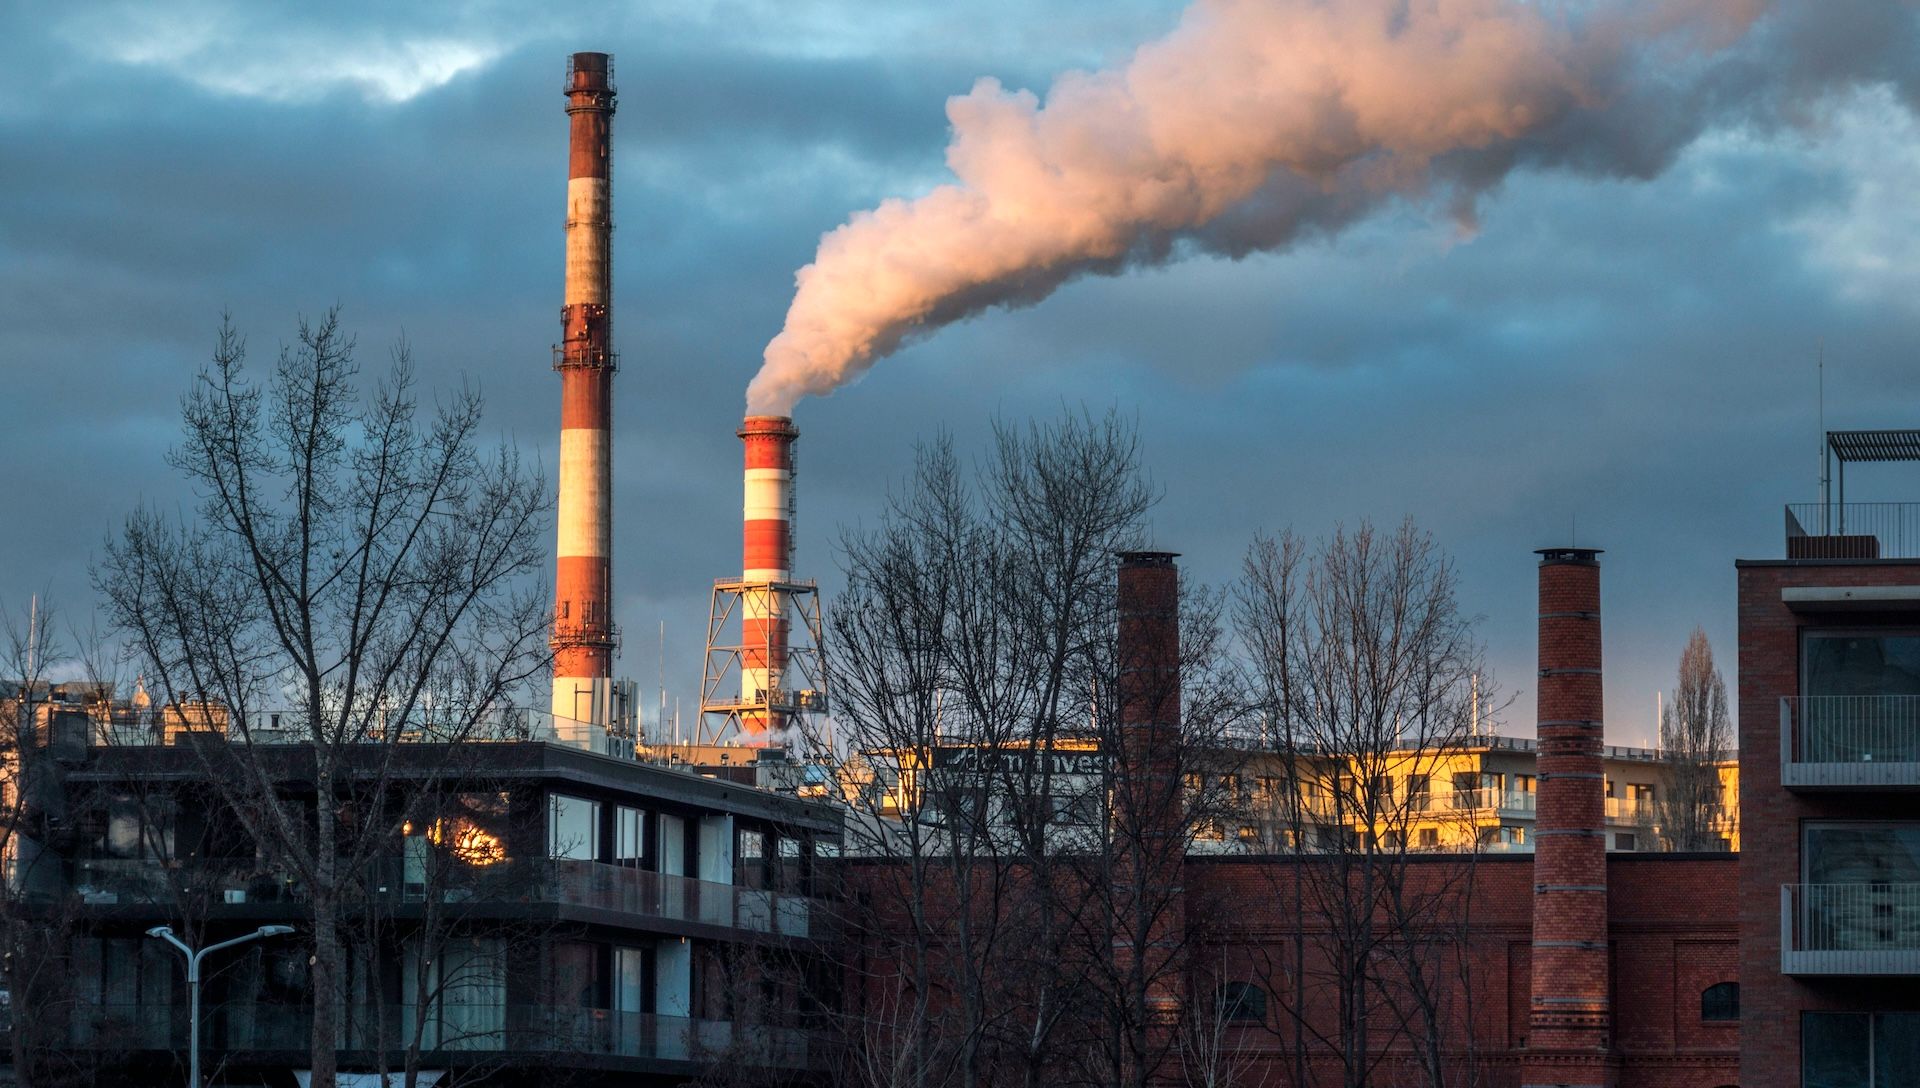
The power sector is the largest contributor to India’s emissions, accounting for about 29% of the country’s emissions, excluding land use change. Although the country’s energy supply continues to rely mainly on fossil fuels, major strides have been made in adding renewable capacity to the fuel mix (source: IEA). As the country’s power demand continues to grow, the country’s electricity authority projects further growth in coal-fired power plants, even though coal plants are increasingly becoming economically unviable.
As a result, emissions from the power sector are likely to continue to grow for some time. However, data shows that the sector may be getting more efficient. Total power sector emissions in India rose from 1,036 MT CO2eq in 2015 to 1,104 MT CO2eq in 2020. Electricity production increased from 1.3 million GWh in 2015 to 1.6 million GWh in 2020. This results in a 11.3% reduction in emissions intensity, thanks in part to a growing share of renewables in the generation mix.
Meanwhile, India is the third largest emitter from the oil refining sector, accounting for 6.27% of emissions from the sector between 2015 to 2020. This is despite the fact that in the last three years, emissions from this sector have been falling. The country is one of the world’s largest oil importers, and has stated plans to boost refining capacity by 20% by 2025.
MANUFACTURING
Manufacturing and industrial processes are the third largest emissions causing category, accounting for a fifth of the country’s emissions (excluding indirect emissions).
Of these, steel is the largest emitting industry, accounting for nearly a quarter of emissions from the sector in 2020, followed by cement production. Due to the impact of COVID-19 related lockdown measures, the sector’s emissions fell by 6.5% in 2020 compared to 2019. However, even in 2019, emissions reduced in some manufacturing subsectors or the rate of growth slowed, possibly due to the Indian economy experiencing an abrupt slowdown.
Explore the data for yourself by visiting the Climate TRACE emissions inventory.


