Going the Distance with Remote Sensing
Remote sensing involves gathering information from a distance. It’s a form of technology we all use every day, from checking the weather on apps that use Doppler radar to track clouds and predict storms, to getting navigational directions based on GPS that tracks location, direction, speed, and other variables.
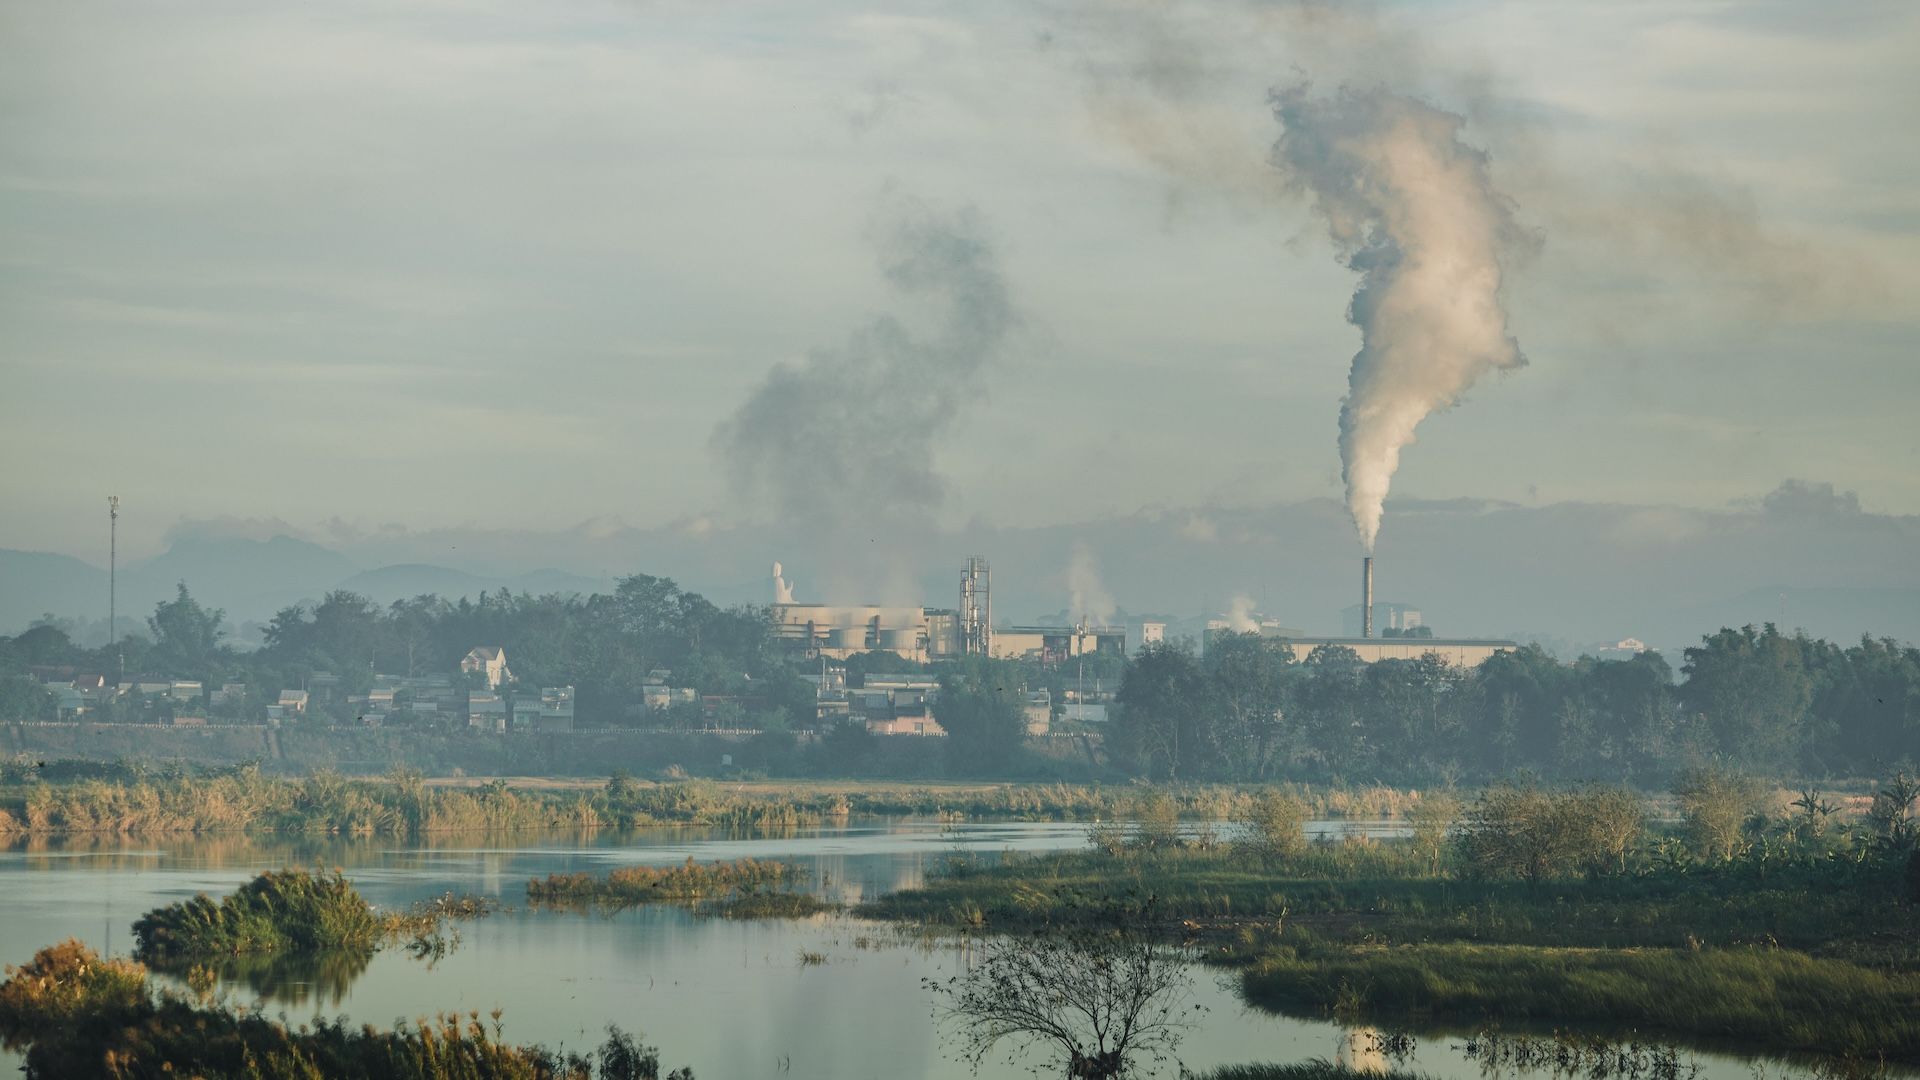
By detecting and monitoring data without having to make physical contact, remote sensing makes it possible to monitor things as varied as the health of a cornfield, a city’s air pollution, and plumes from a power plant.
What is remote sensing?
In the case of Climate TRACE, remote sensing allows us to collect information about the Earth’s surface and atmosphere to track emissions-causing activities and calculate the associated greenhouse gas (GHG) emissions. Similar to how X-rays, CT scans, and magnetic resonance imaging each measure what the human eye can’t see, remote sensing detects electromagnetic waves, including from the visible, heat (infrared), sound (audio), and radio portions of the spectrum. Remote sensing breaks down into two basic categories:
— Active sensing pings a laser beam or transmits a signal to see what does or doesn’t bounce back. Doppler weather radar works exactly this way. It sends out a signal and then “listens” for the reflected echo from the atmosphere. Other ways active sensing can be used include measuring the height of trees in an area for the forestry sector and the depth of an iron mine for the mining sector.
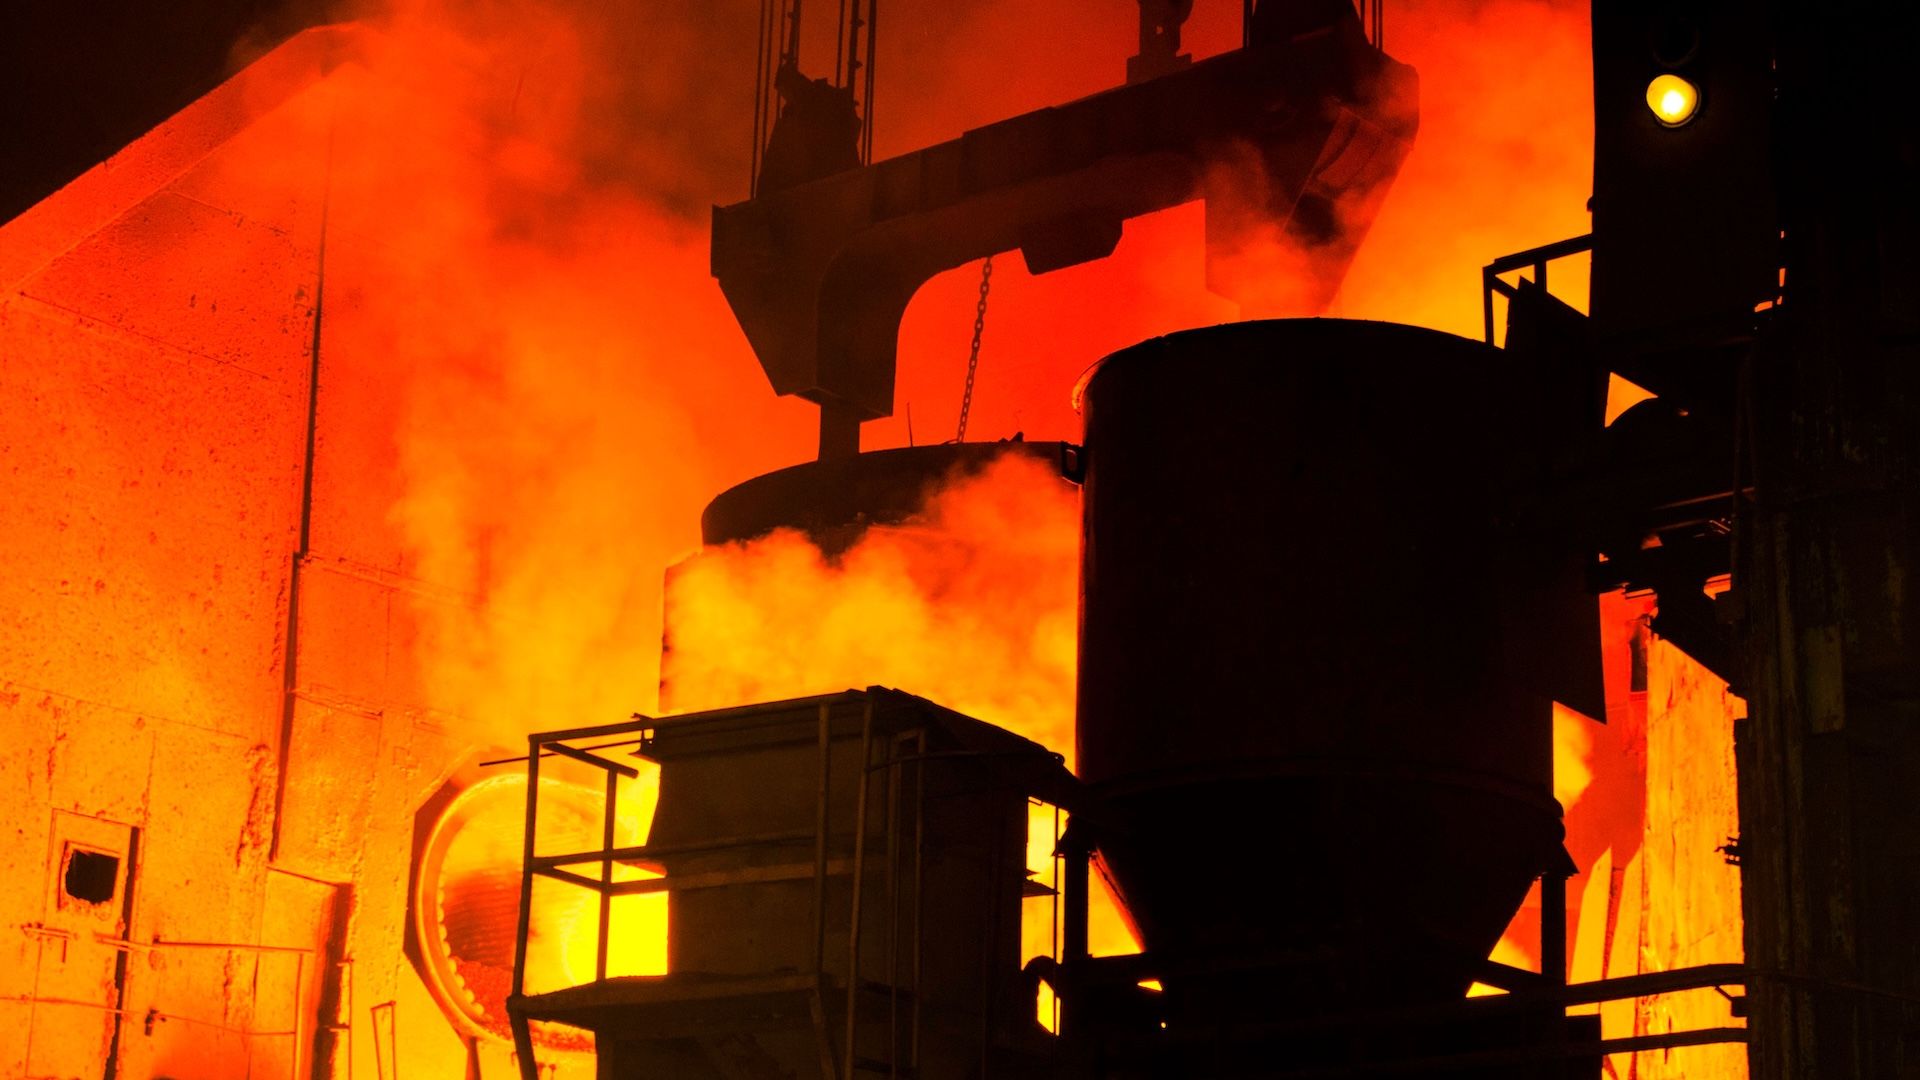
— Passive sensing measures emitted or reflected natural electromagnetic waves from a distance. For example, satellites monitoring the infrared (heat) spectrum can measure the released heat emitted from steel factories, aluminum smelters, or fossil-fueled power plants.
Three types of remote sensing
Whether they’re doing active sensing, passive sensing, or both, remote sensors can be mounted on space-based satellites orbiting the Earth, on moving objects such as airplanes and drones, and on fixed (stationary) objects such as tall buildings or towers.
***— Space-based sensors.***Mounted on space-based platforms (such as the International Space Station or a satellite), these sensors provide global coverage and can also focus on a specific region. Depending on the satellite's purpose and revisit schedule, the frequency of measurements can vary from minutes to daily to weekly to even bi-monthly.
— Aerial-based sensors. These are mounted on airplanes and drones to provide measurements over a larger area, but with less frequency than ground-based sensors.
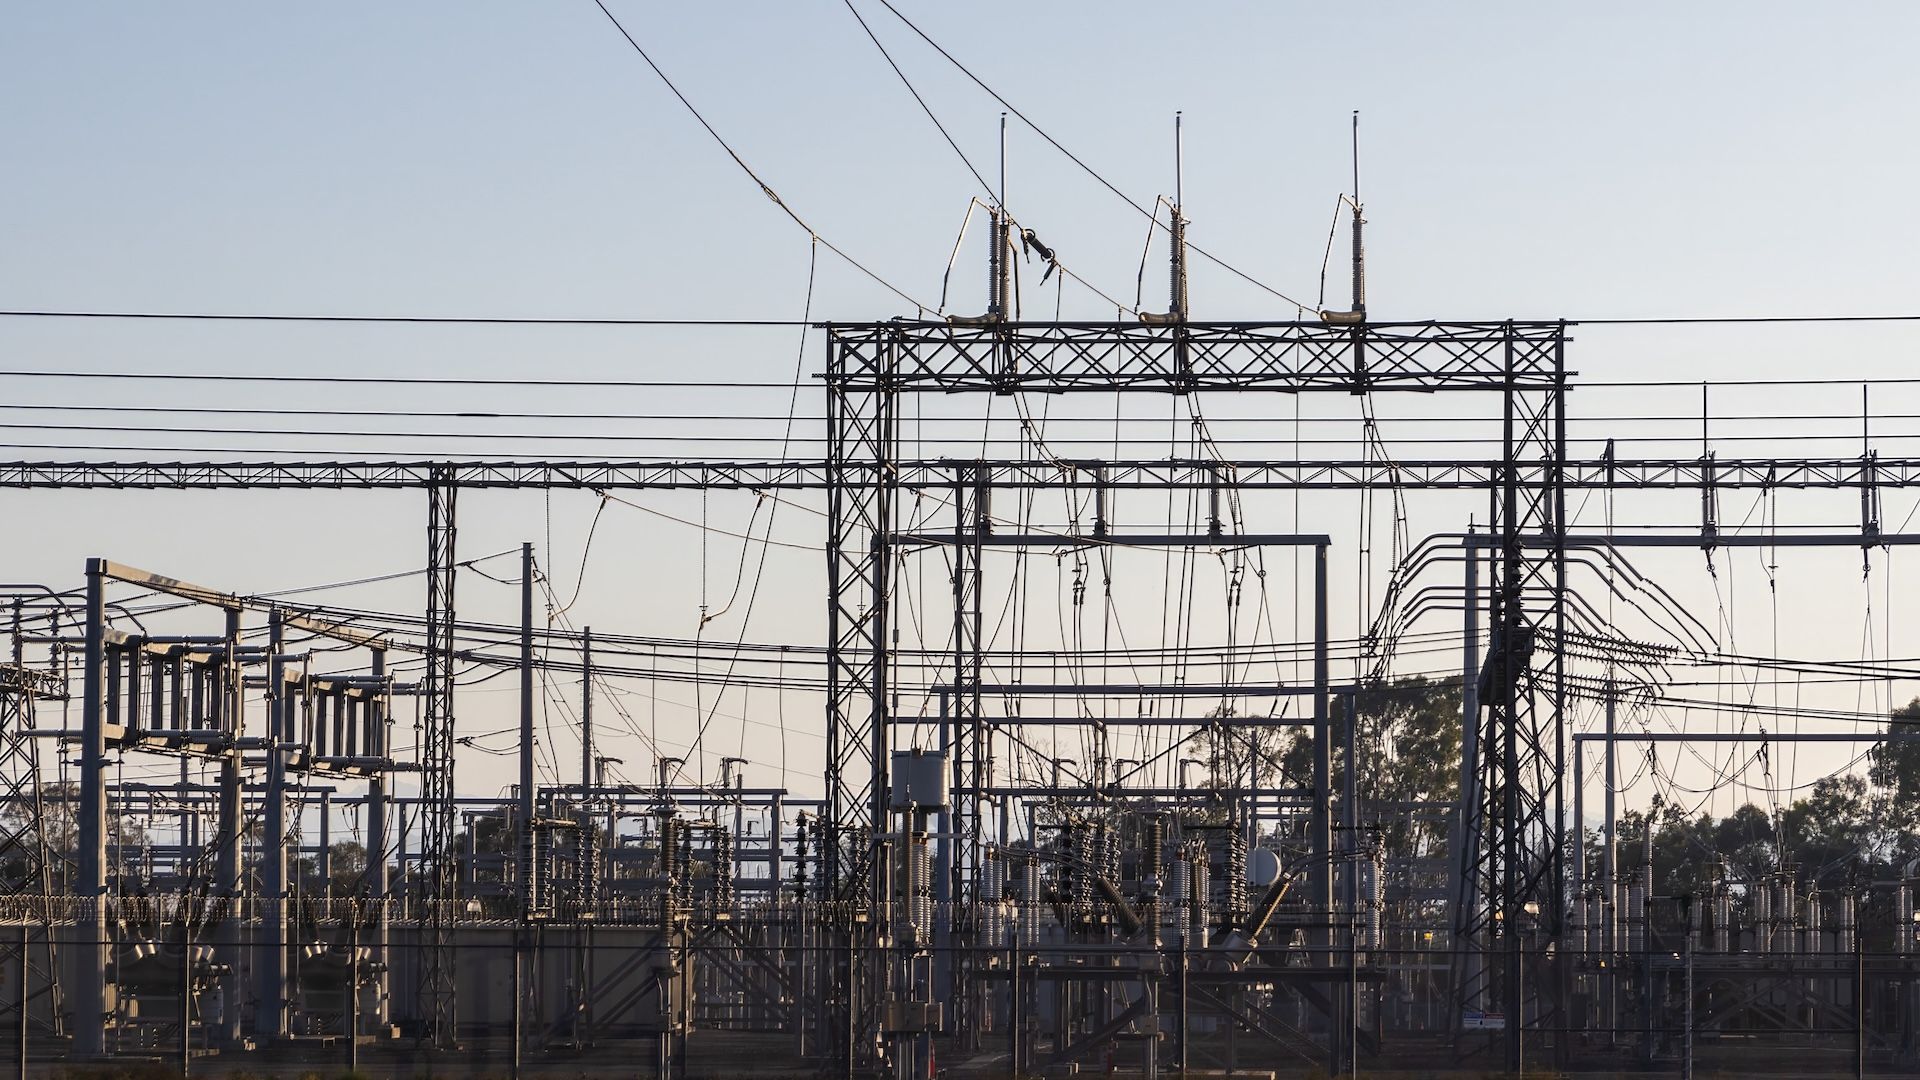
***— Ground-based sensors.***These can be fixed (such as building- or tower-mounted) or even handheld (think smartphones) to measure phenomena at close range and high frequency (e.g., every 5, 10, or 15 minutes). Ground-based sensors mounted on buildings can measure GHGs emissions at busy traffic intersections, emissions from power plant smokestacks, or even plant health in a field.
To date, Climate TRACE primarily uses satellite-based remote sensing due to the global coverage offered over the other types.
How remote sensing measurements work
All forms of remote sensing detect electromagnetic (EM) energy coming from (or reflected by) the Earth’s surface and atmosphere. EM energy travels as waves; the corresponding wavelengths are classified according to frequency. Combining all possible EM wavelengths together — X-ray, ultraviolet, visible, infrared, thermal, and microwave — creates the full EM spectrum.
With the satellite-based remote sensing that is core to Climate TRACE’s GHG emissions calculations, three major variables next come into play:
***— Spectral resolution,***which refers to which wavelength(s) or wavelength bands a sensor covers. For example, the European Space Agency’s Sentinel-2A and -2B satellites have a multispectral resolution spanning 13 wavelength bands across the visible, near infrared, and shortwave infrared portions of the EM spectrum.
— Spatial resolution, which refers to how much detail the sensor can “see” in an image. In remote sensing, images are made up of pixels, the smallest unit in an image and represented as squares. But one pixel in an image could correspond to one meter, or 50 meters, or 1 kilometer in the real world — depending on the spatial resolution.
***— Temporal resolution,***which refers to how often a remote sensor collects data. In the context of satellites, temporal resolution is driven by revisit frequency (the time it takes for the satellite to pass over and observe the same location again). Factors that impact temporal resolution are the satellite’s orbit, the size of an area imaged (called “swath” size), and sensor characteristics. For example, Terra and Aqua satellites have a 1- to 2-day revisit, while Sentinel-2A and -2B satellites have 10 days each (combined, 5-day revisit), and Landsat 8 and 9 satellites have a 16-day revisit.
For more details about spectral, spatial, and temporal resolution, please read our previousexplainer about satellite imagery.
The value of remote sensing at Climate TRACE
Remote sensing strategy plays an instrumental role in our GHG emissions calculations. Thanks to remote sensor data, we can:
— Collect information over large areas
— Obtain direct measurements of natural features or physical objects
— Monitor change over time
— Fill in gaps in information where ground-truth data is unavailable
— Augment data from other sources to aid decision-making
This last benefit is in some ways the most powerful of them all. Climate TRACE combines remote sensing with satellite imagery and ground truth data to paint the fullest picture possible. Certain categories of remote sensing can also inform ground truth 'training' data for our AI/ML algorithms.
All told, remote sensing plays an important role in Climate TRACE’s data science toolbox, helping us track GHG emissions from a world’s worth of sources, as they happen.