Climate TRACE Releases September 2025 Emissions Data
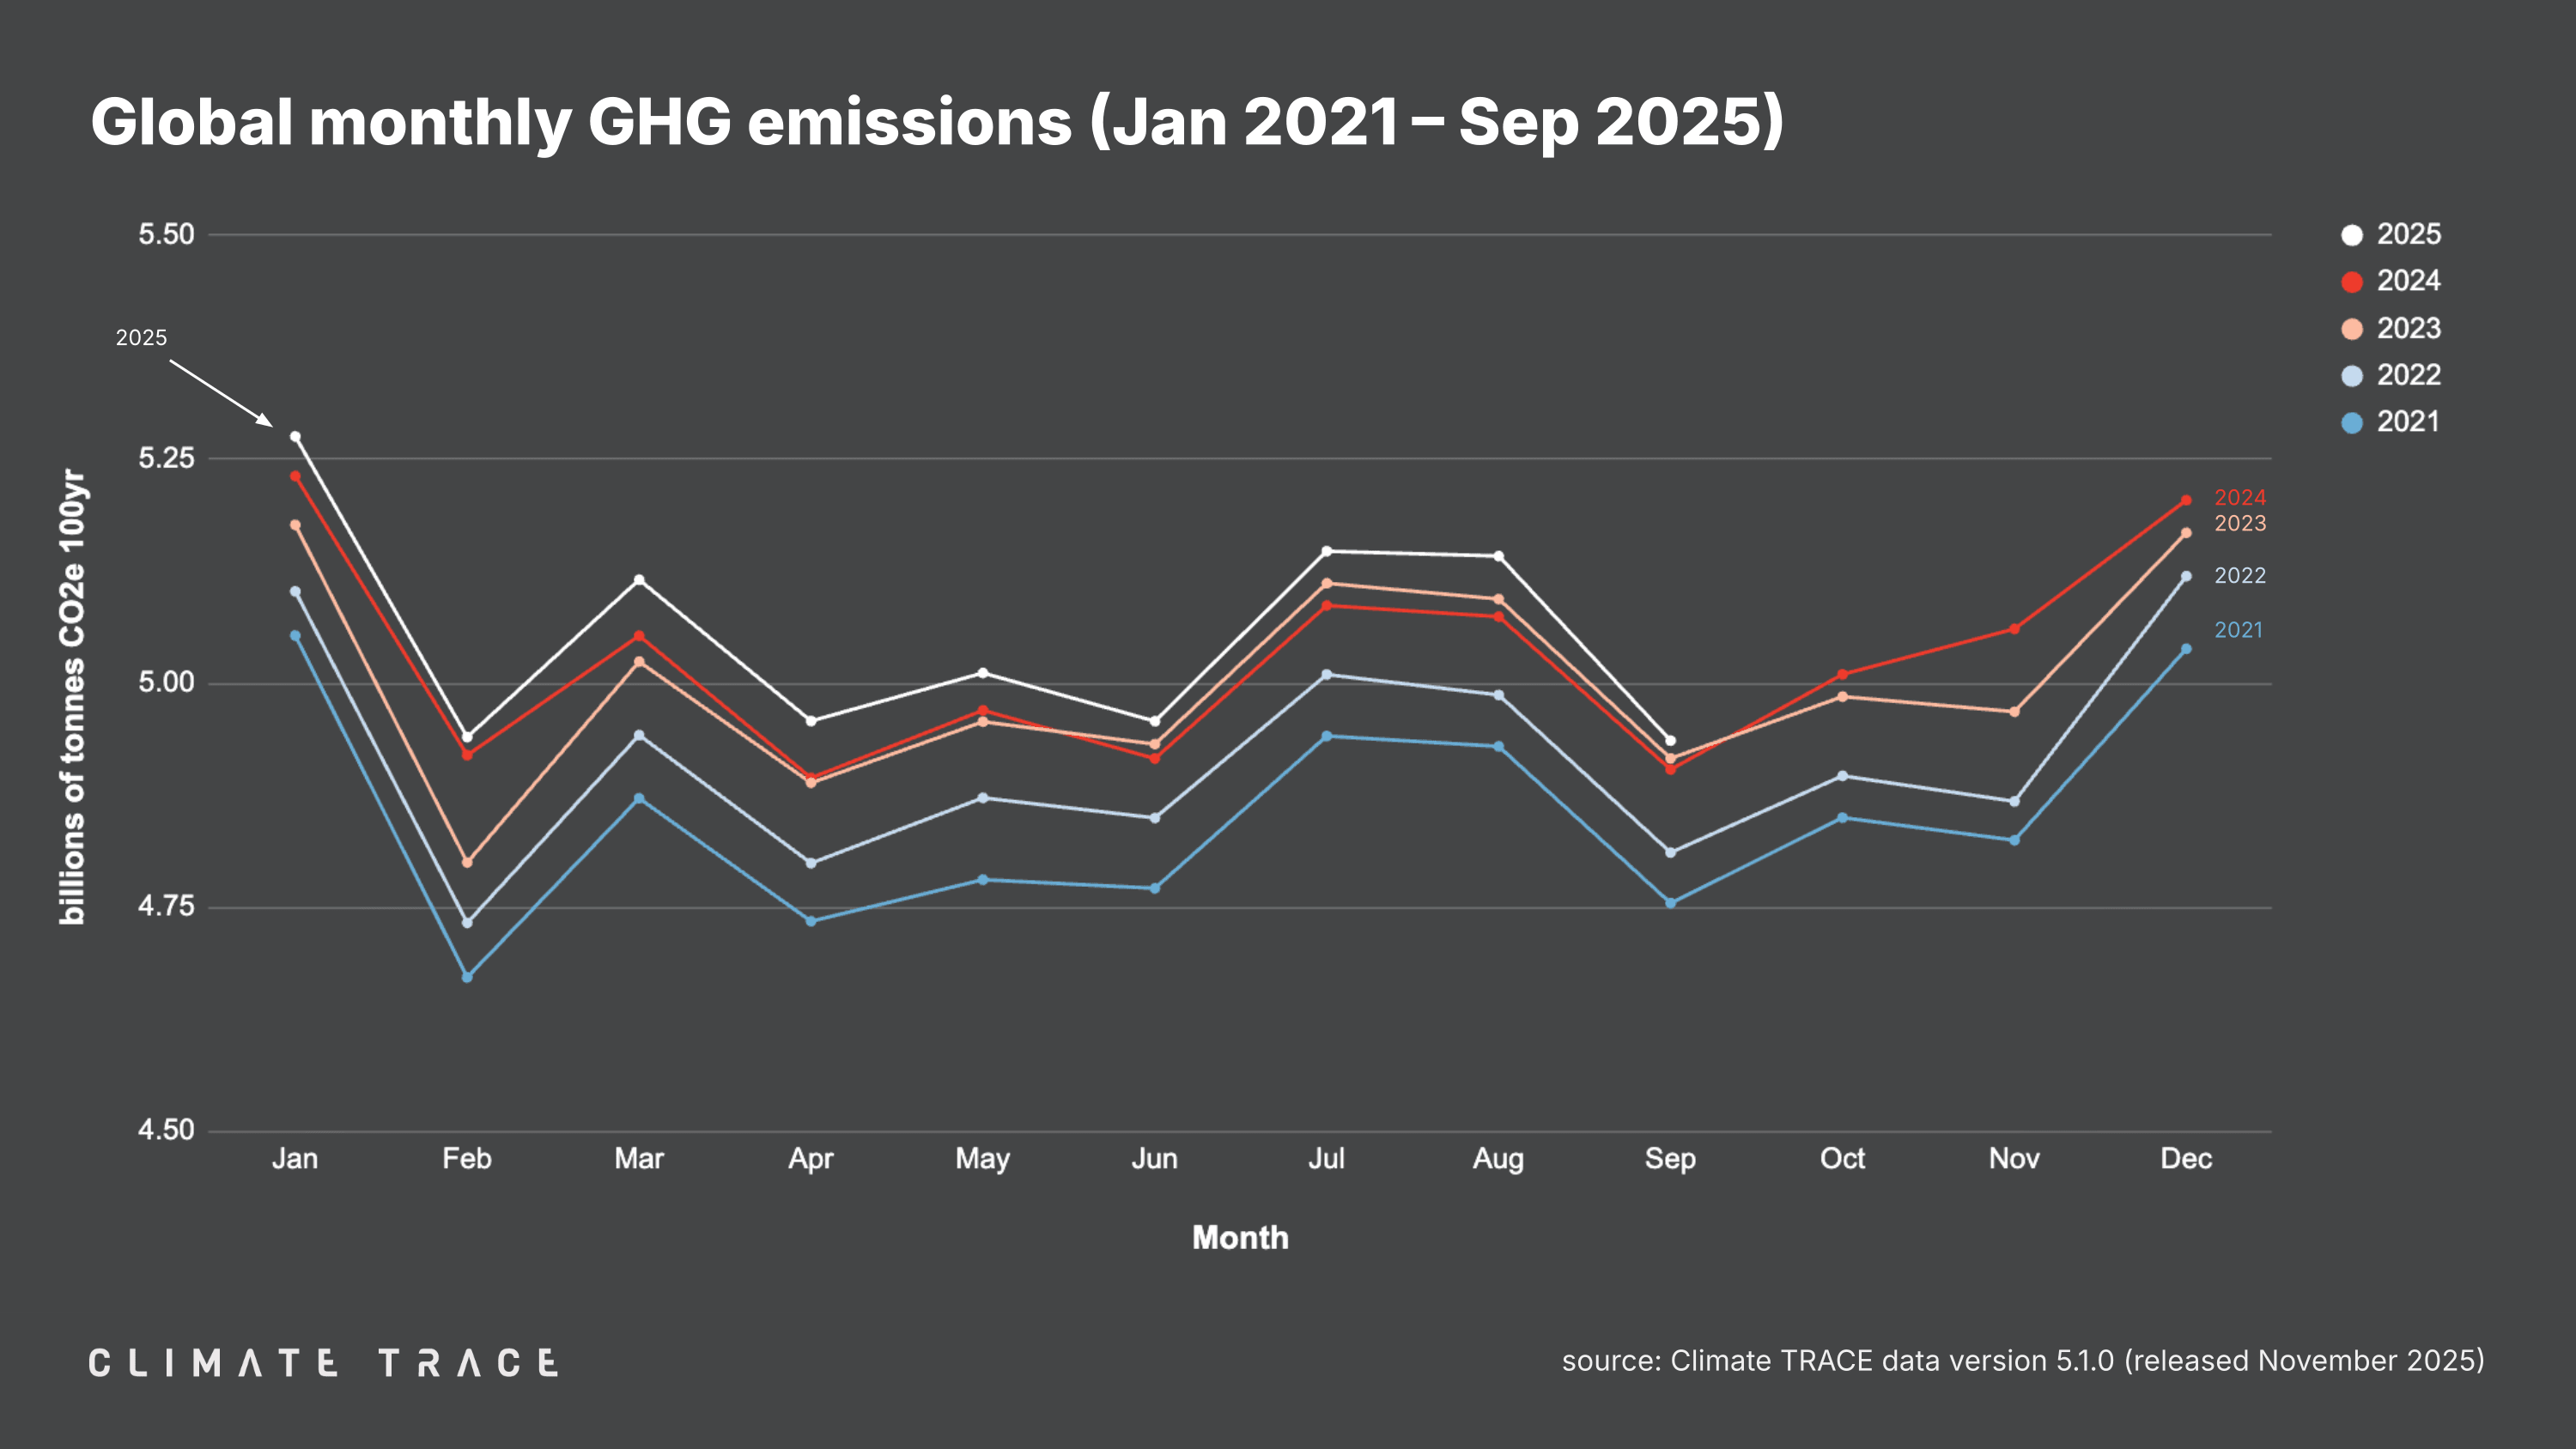
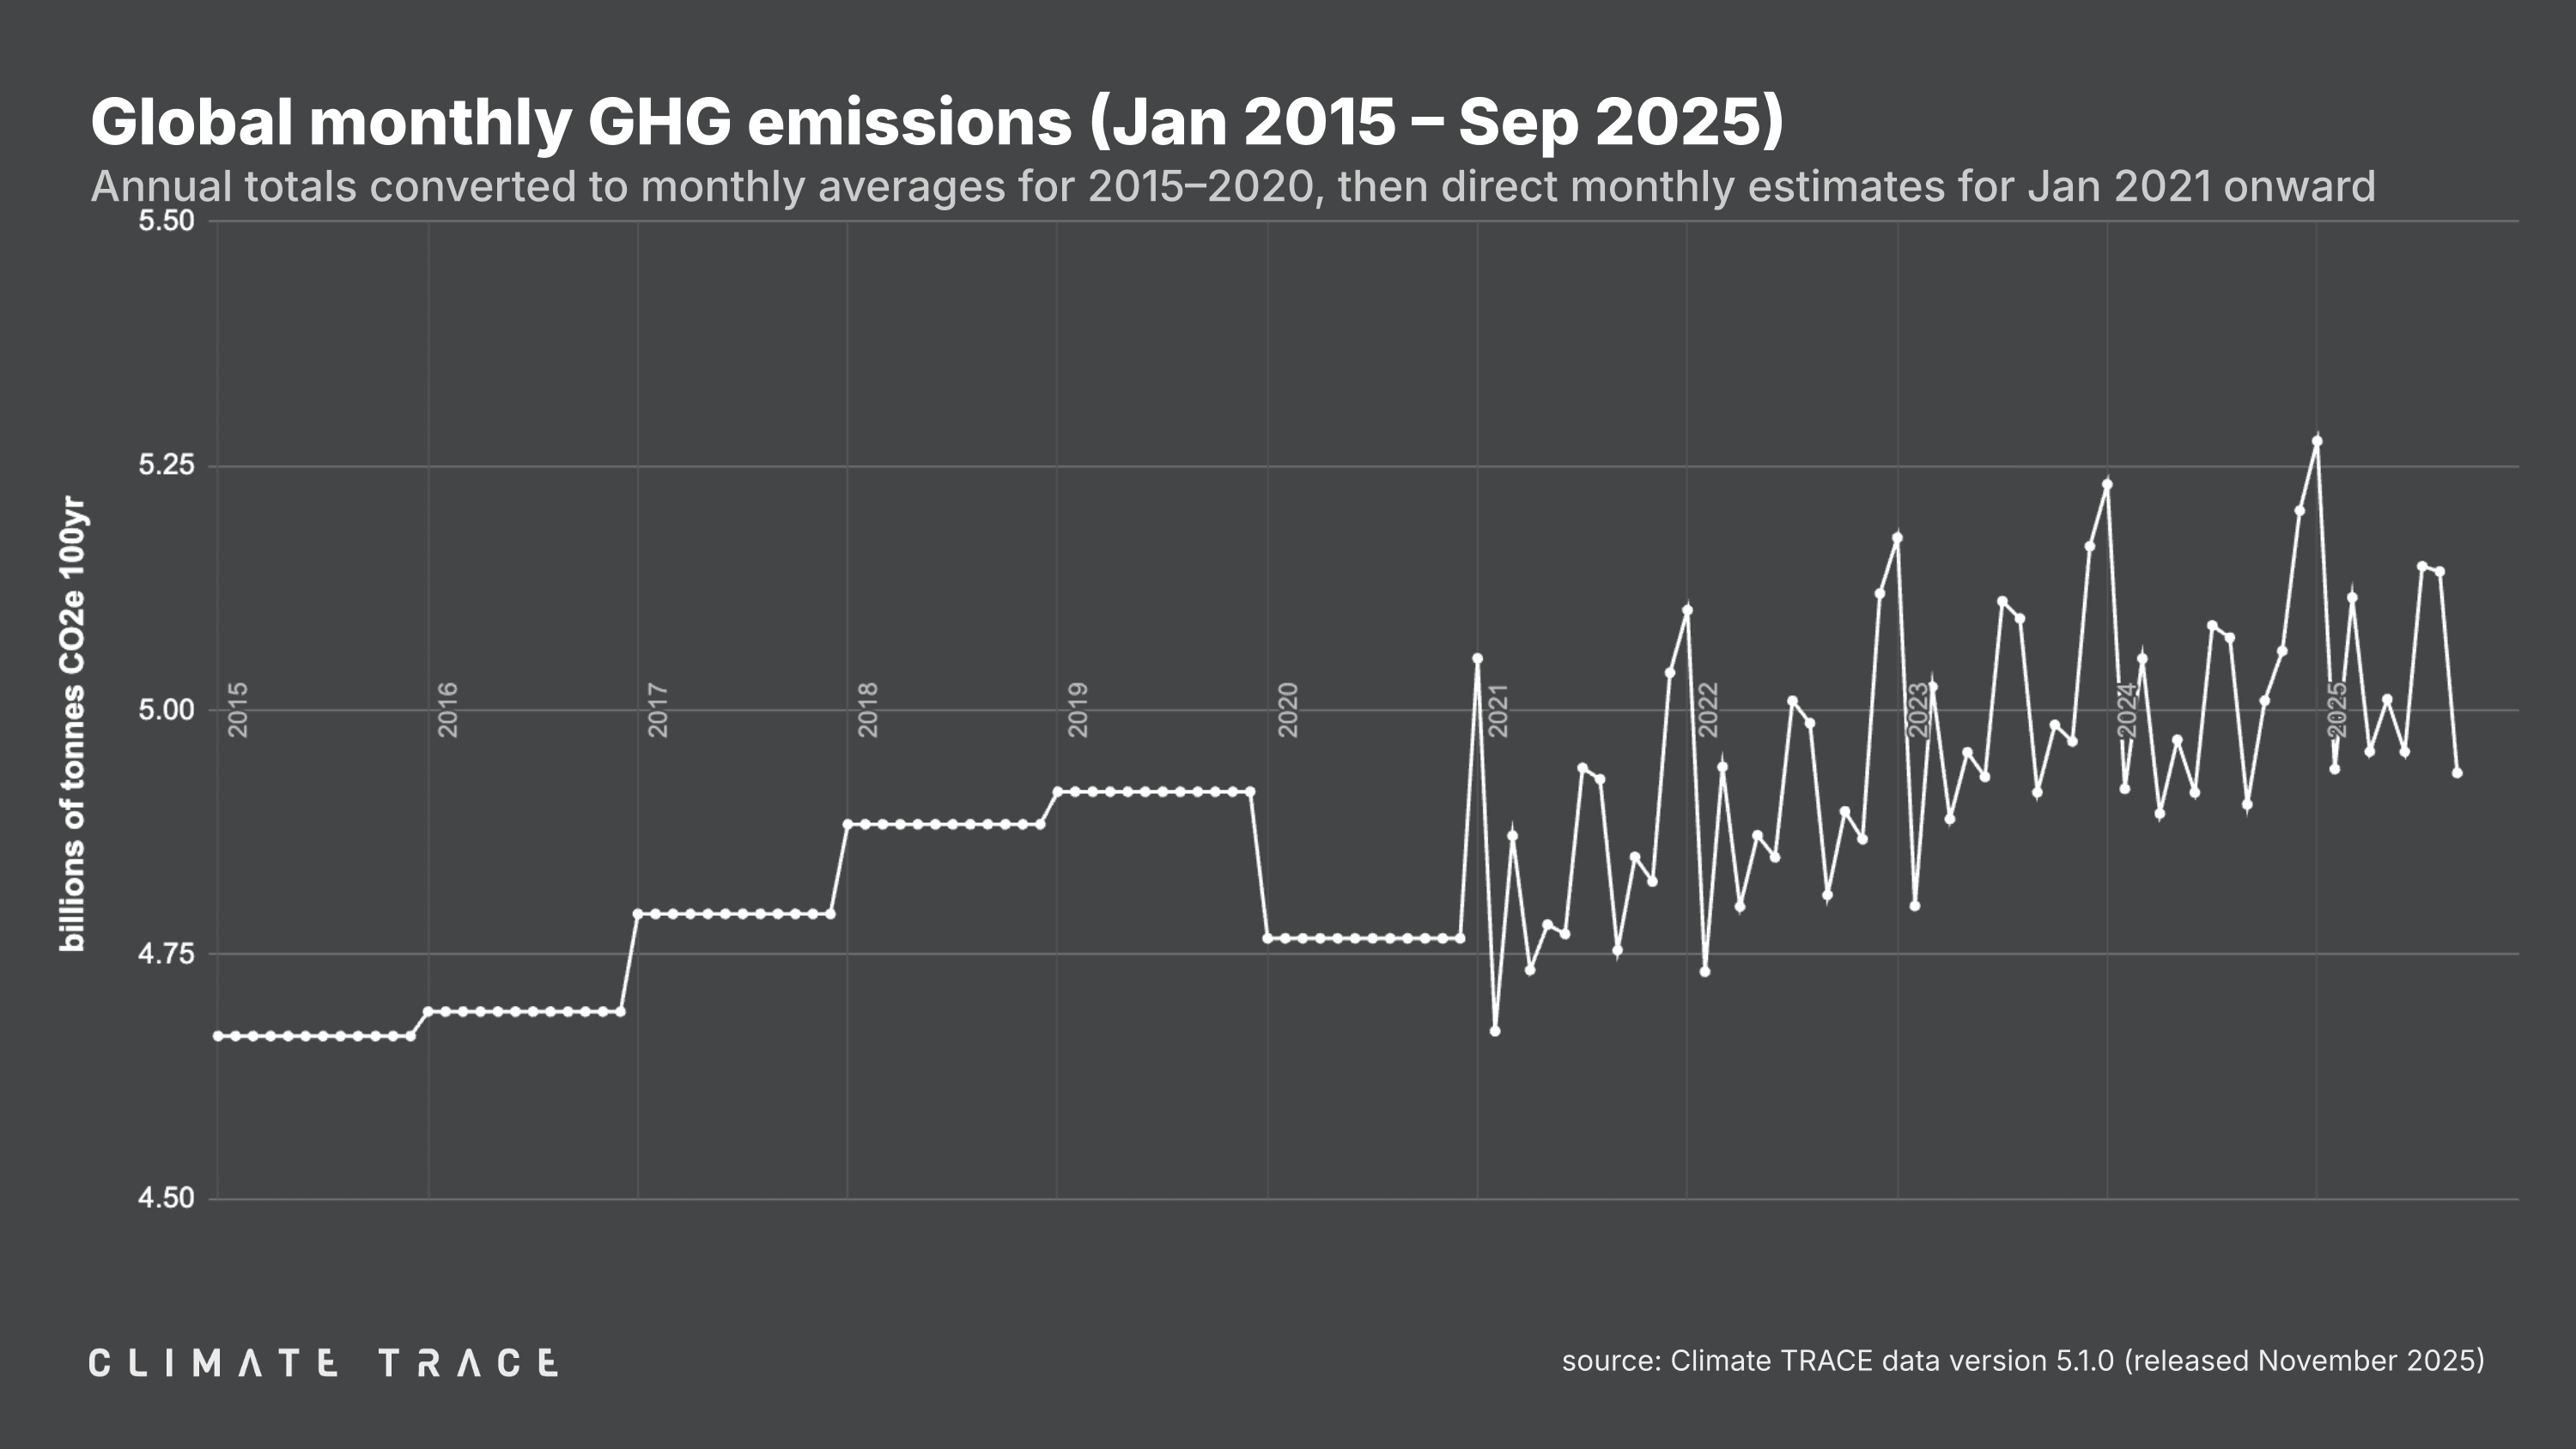
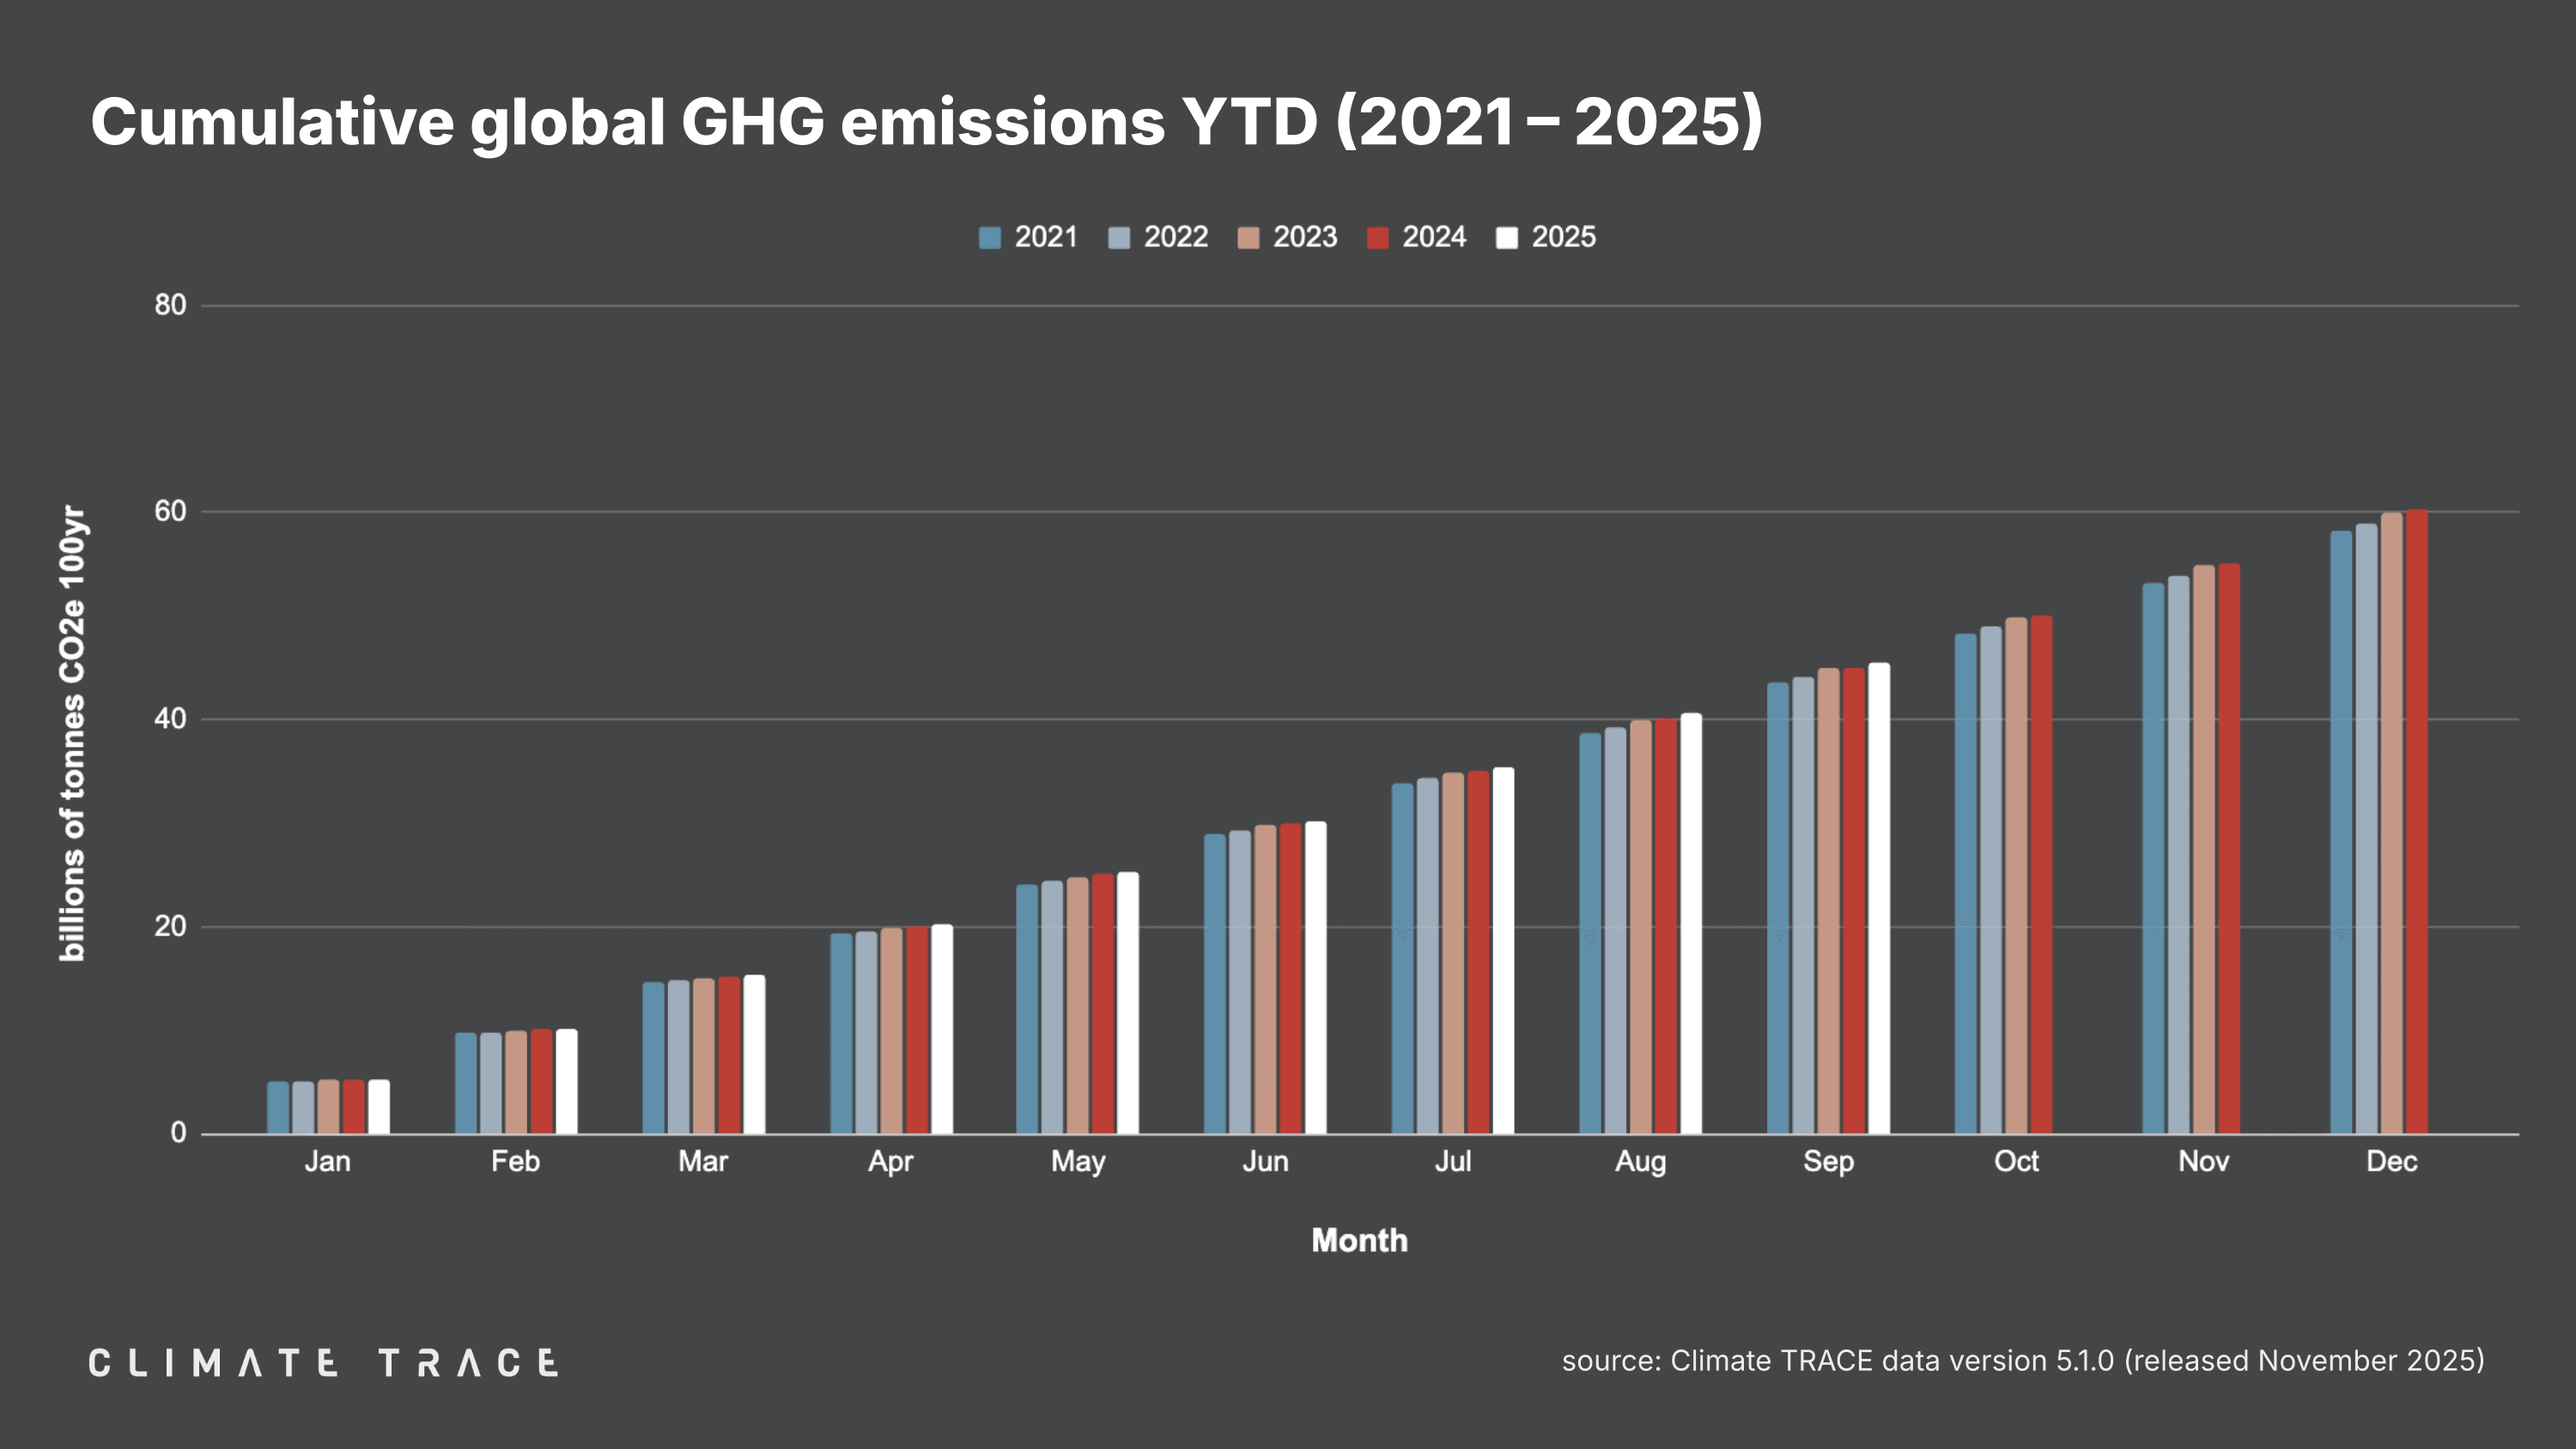
November 25, 2025 -- Today, Climate TRACE reported that global greenhouse gas (GHG) emissions for the month of September 2025 totaled 4.94 billion tonnes CO₂e. This represents an increase of 0.66% vs. September 2024. Total global year-to-date emissions are 45.48 billion tonnes CO₂e. This is 0.96% higher than 2024's year-to-date total. Global methane emissions in September 2025 were 34.43 million tonnes CH₄, an increase of 0.54% vs. September 2024.
Data tables summarizing GHG emissions totals by sector, country, and top 100 urban areas for September 2025 are available for download here. Climate TRACE monthly data releases now include data on fine particulate matter (PM2.5) emissions, in addition to monthly GHG emissions.
Lookback: Global Greenhouse Gas Emissions Through Q3 2025
Climate TRACE data now cover global emissions through the end of Q3 2025. The sector that saw the greatest increase in emissions as compared to the same time period in 2024 was transportation, for which emissions rose by 3.55% (an increase of 244.47 million tonnes of CO₂e). The United States and China accounted for a third of that increase. Fossil fuel operations emissions also rose, growing by 2.07% as compared to the same period in 2024 (an increase of 149.66 million tonnes of CO₂e), led by increases in Russia, Kazakhstan, China, Saudi Arabia, and Brazil.
Meanwhile, global power sector emissions saw the biggest decline in the first three quarters of 2025 compared to the same time period in 2024, falling by 0.30% (a decrease of 35.68 million tonnes of CO₂e). The decrease was driven almost entirely by declines in China and India, where power emissions were 0.88% lower and 0.91% lower than their totals in the first three quarters of 2024, respectively.
Year-to-date emissions through Q3 2025 show small but positive progress on decarbonization in the Philippines, India, Vietnam, and South Africa:
-
Philippines emissions decreased 18 million tonnes CO₂e, or 4.58%;
-
India emissions decreased 10.05 million tonnes CO₂e, or 0.31%;
-
Vietnam emissions decreased 9.57 million tonnes CO₂e, or 4.98%;
-
South Africa emissions decreased 8.22 million tonnes CO₂e, or 1.85%.
However, some of the world's other major emitting economies, including China, the US, the EU, Russia, Indonesia, and Brazil, saw year-to-date emissions rise in 2025:
-
China year-to-date emissions increased by 12.24 million tonnes CO₂e, or 0.09% compared to the same period in 2024;
-
United States emissions increased by 71.31 million tonnes CO₂e, or 1.36%;
-
European Union emissions increased by 19.01 million tonnes CO₂e, or 0.68%;
-
Russia emissions increased by 48.64 million tonnes CO₂e, or 2.09%;
-
Indonesia emissions increased by 81.56 million tonnes CO₂e, or 7.63%;
-
Brazil emissions increased by 20.23 million tonnes CO₂e, or 2.0%.
Greenhouse Gas Emissions by Country: September 2025
Climate TRACE's preliminary estimate of September 2025 emissions in China, the world's top emitting country, is 1.40 billion tonnes CO₂e, an increase of 5.27 million tonnes of CO₂e, or 0.38% vs. September 2024.
Of the other top five emitting countries:
-
United States emissions increased by 6.49 million tonnes CO₂e, or 1.15% year over year;
-
India emissions increased by 0.88 million tonnes CO₂e, or 0.25% year over year;
-
Russia emissions increased by 0.16 million tonnes CO₂e, or 0.06% year over year;
-
Indonesia emissions increased by 8.02 million tonnes CO₂e, or 6.49% year over year.
In the EU, which as a bloc would be the fourth largest source of emissions in September 2025, emissions increased by 0.77 million tonnes CO₂e compared to September 2024, or 0.26%.
Greenhouse Gas Emissions by Sector: September 2025
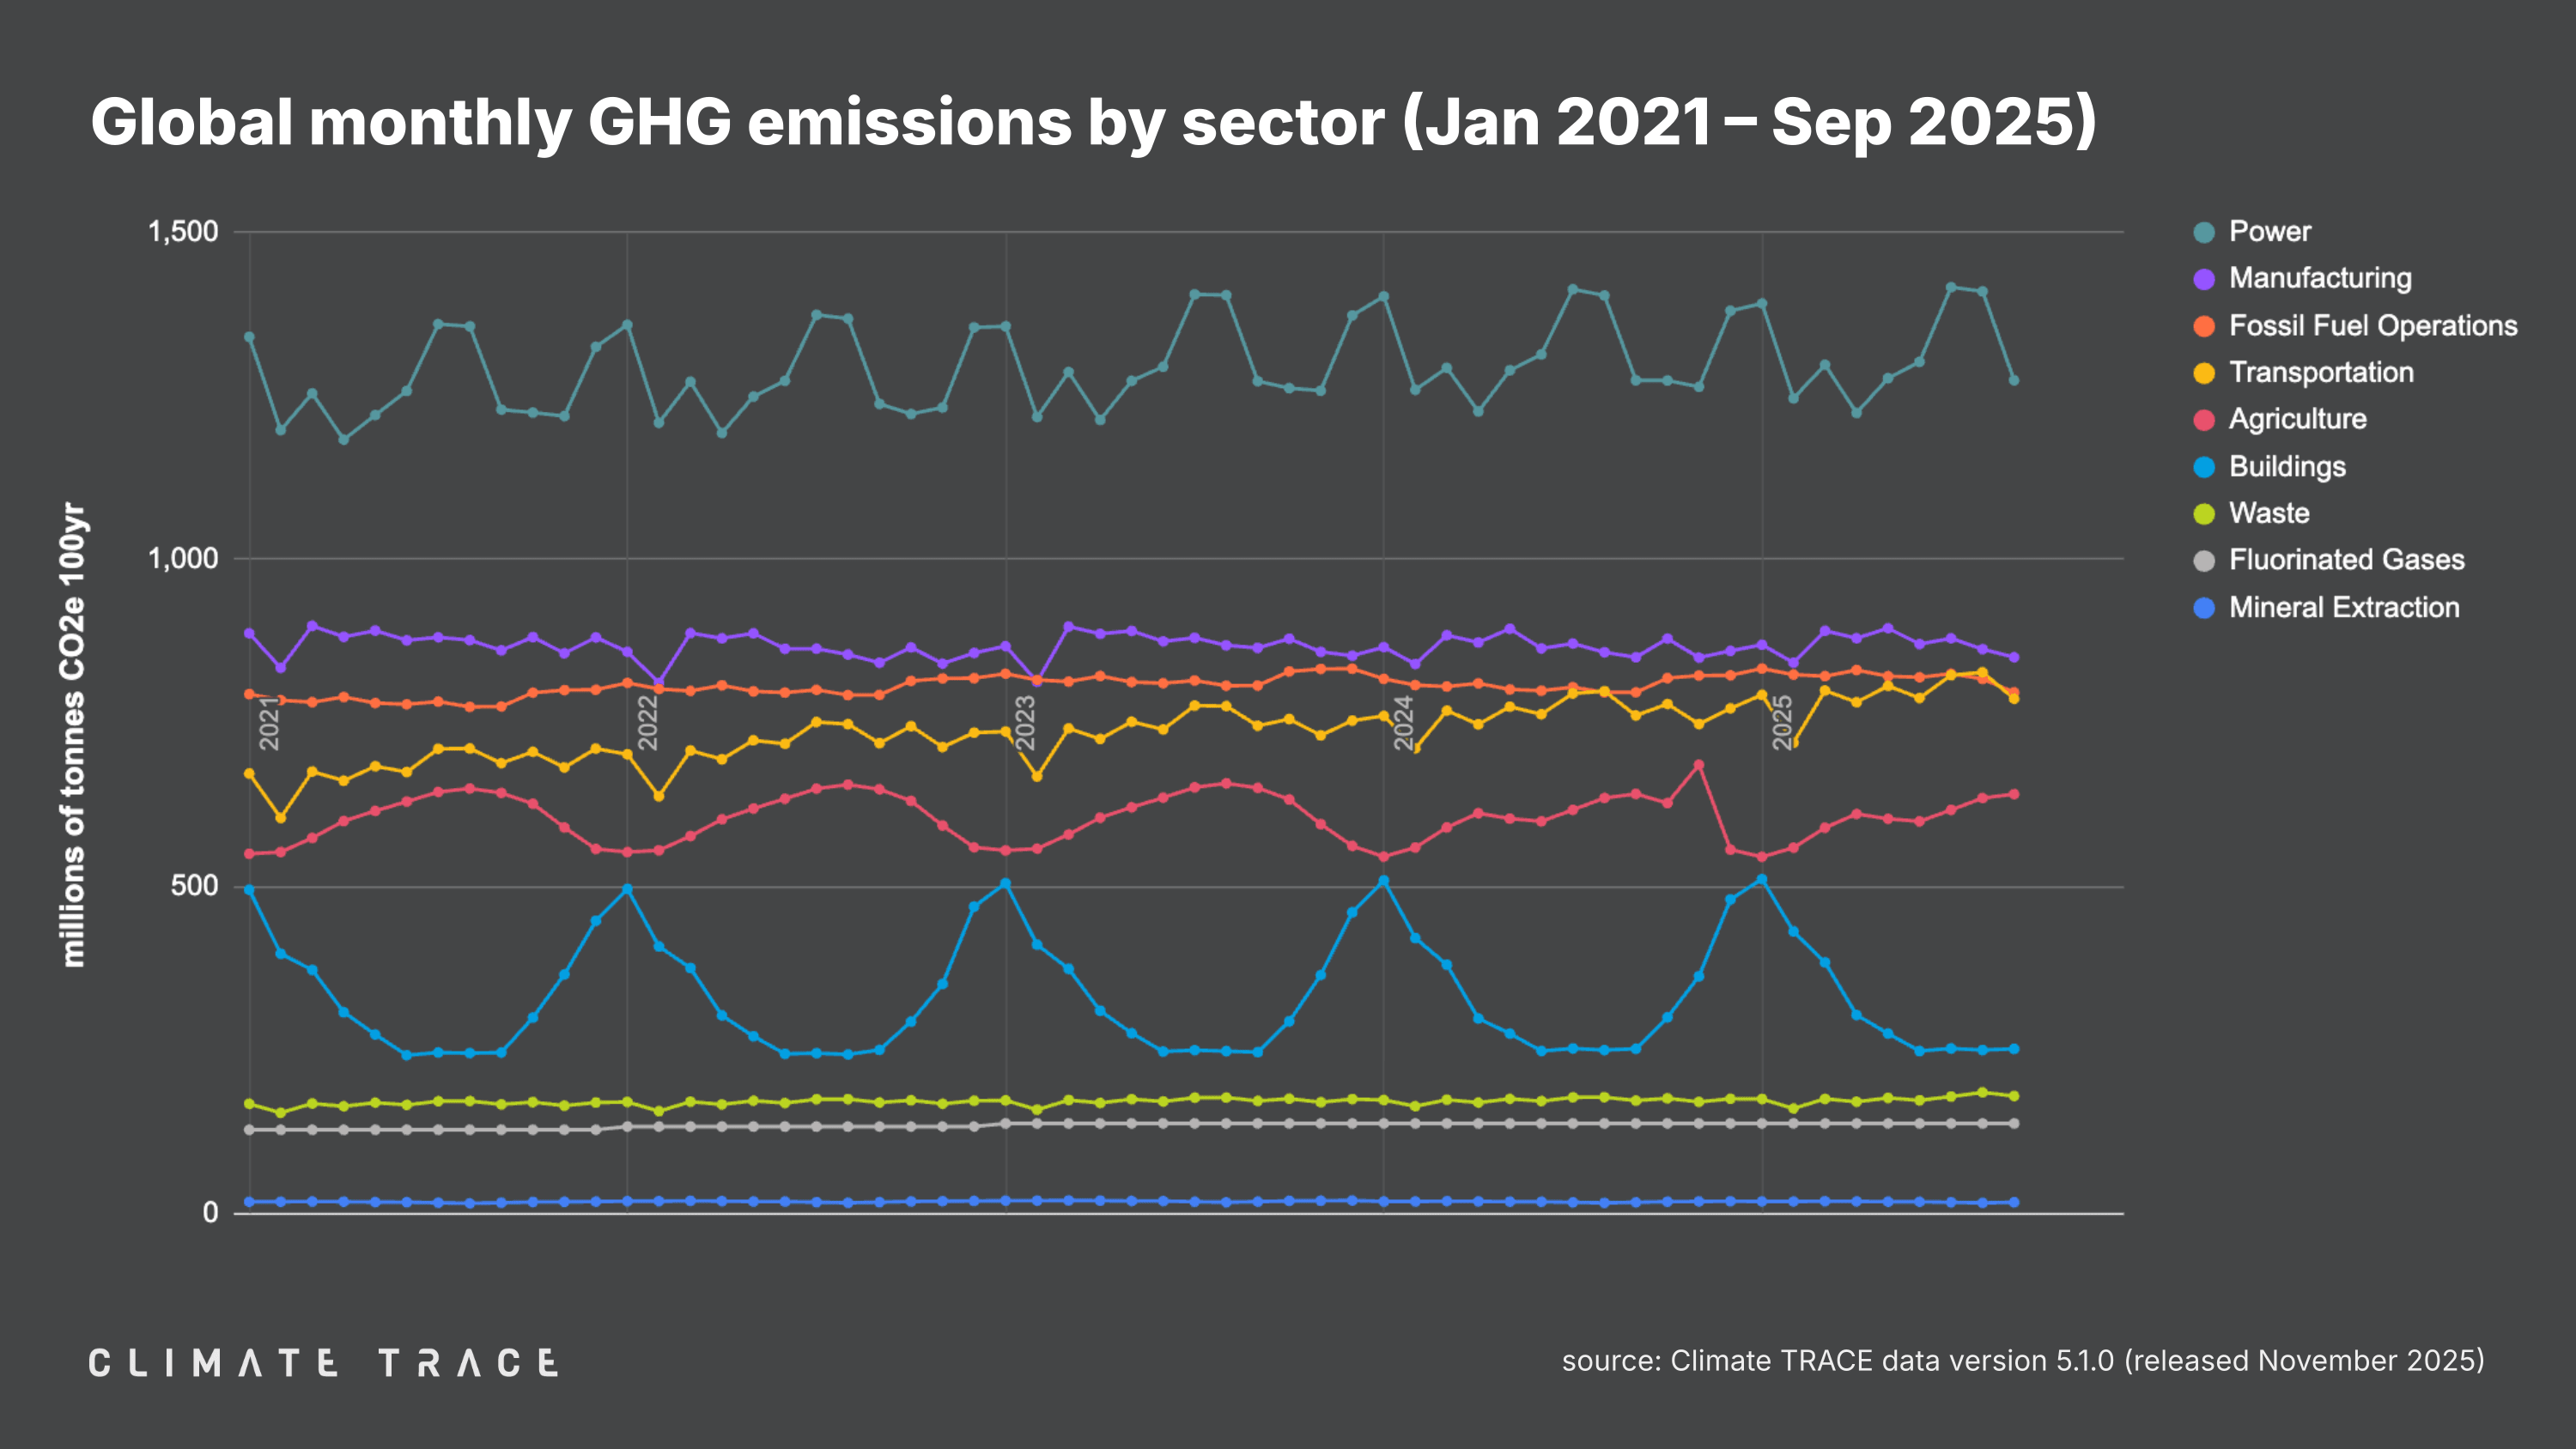
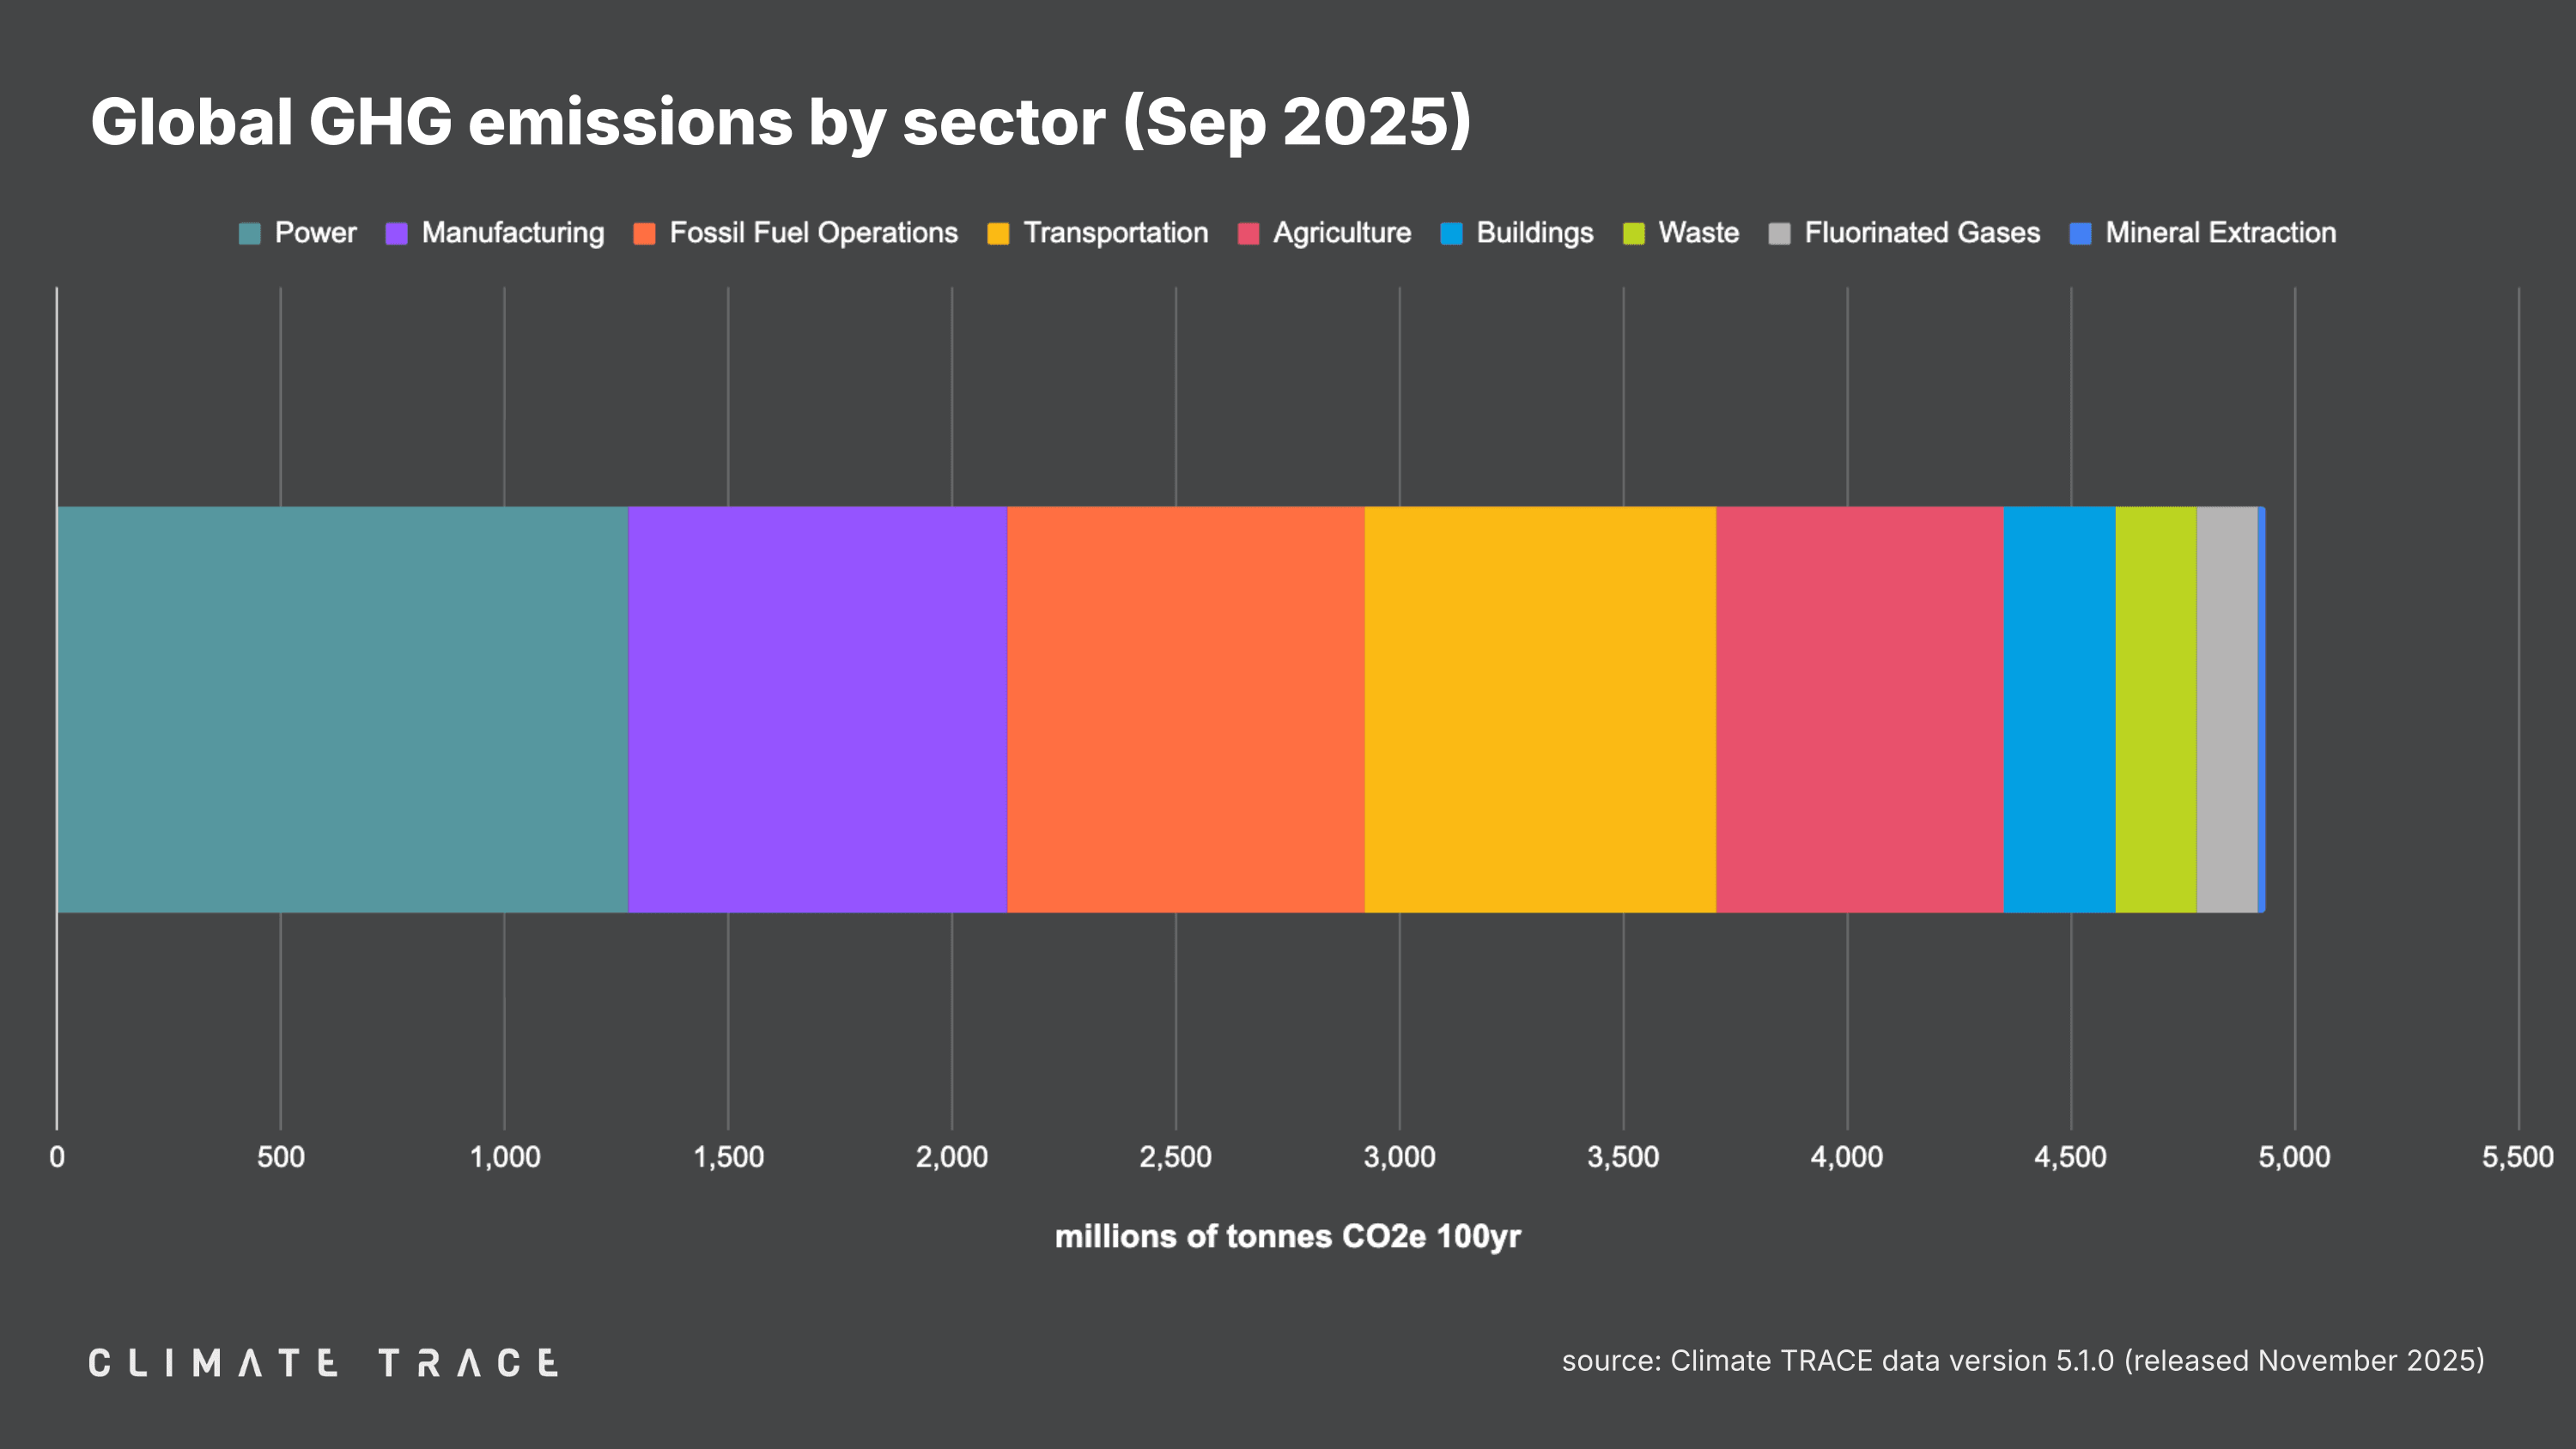
Greenhouse gas emissions increased in September 2025 vs. September 2024 in transportation and waste, and decreased in agriculture. Waste saw the greatest change in emissions year over year, with emissions increasing by 4.08% as compared to September 2024.
-
Agriculture emissions were 641.20 million tonnes CO₂e, a 0.05% decrease vs. September 2024;
-
Buildings emissions were 251.77 million tonnes CO₂e, unchanged vs. September 2024;
-
Fluorinated gases emissions were 137.71 million tonnes CO₂e, unchanged vs. September 2024;
-
Fossil fuel operations emissions were 796.89 million tonnes CO₂e, unchanged vs. September 2024;
-
Manufacturing emissions were 850.53 million tonnes CO₂e, unchanged vs. September 2024;
-
Mineral extraction emissions were 17.11 million tonnes CO₂e, unchanged vs. September 2024;
-
Power emissions were 1,273.99 million tonnes CO₂e, unchanged vs. September 2024;
-
Transportation emissions were 787.04 million tonnes CO₂e, a 3.35% increase vs. September 2024;
-
Waste emissions were 179.66 million tonnes CO₂e, a 4.08% increase vs. September 2024.
Greenhouse Gas Emissions by City: September 2025
The urban areas with the highest total GHG emissions in September 2025 were Shanghai, China; Tokyo, Japan; Houston, United States; Los Angeles, United States; and New York, United States.
The urban areas with the greatest increases in absolute emissions in September 2025 as compared to September 2024 were Jakarta, Indonesia; Yogyakarta, Indonesia; Cairo, Egypt; Lima, Peru; and Surabaya, Indonesia. Those with the largest absolute emissions declines between this September and last September were Ho Chi Minh City, Vietnam; Quezon City [Manila], Philippines; Accra, Ghana; Hanoi, Vietnam; and Bangkok, Thailand.
The urban areas with the greatest increases in emissions as a percentage of their total emissions were Nunukan, Indonesia; Baidi, China; Nouadhibou, Mauritania; Dongtou, China; and Arga Makmur, Indonesia. Those with the greatest decreases by percentage were Alotau, Papua New Guinea; Atebubu, Ghana; Yendi, Ghana; Gushiegu, Ghana; and Bawku, Ghana.
RELEASE NOTES
Revisions to existing Climate TRACE data are common and expected. They allow us to take the most up-to-date and accurate information into account. As new information becomes available, Climate TRACE will update its emissions totals (potentially including historical estimates) to reflect new data inputs, methodologies, and revisions.
With the addition of September 2025 data, the Climate TRACE database is now updated to version V5.1.0. Note: V5.0.0 launched at COP30 and now includes data on potential options for reducing emissions at every asset in the Climate TRACE database.
V5.1.0 includes new modeling of cropland fires, additional sources and updated emissions factors across multiple mining subsectors, updated estimates for solid waste disposal using more detailed input data, updated non-GHG emissions in petrochemical steam cracking, updated SO₂ and PM2.5 emissions globally, and updated GHG emissions in North America and Europe in the oil and gas transport and production sectors.
A detailed description of data updates is available in our changelog here.
To learn more about what is included in our monthly data releases and for frequently asked questions, click here. All methodologies for Climate TRACE data estimates are available to view and download here. For any further technical questions about data updates, please contact: coalition@ClimateTRACE.org.
To sign up for monthly updates from Climate TRACE, click here.
Emissions data for October 2025 are scheduled for release on December 18, 2025.
About Climate TRACE
The Climate TRACE coalition was formed by a group of AI specialists, data scientists, researchers, and nongovernmental organizations. Current members include Carbon Yield; Carnegie Mellon University's CREATE Lab; CTrees; Duke University's Nicholas Institute for Energy, Environment & Sustainability; Earth Genome; Former Vice President Al Gore; Global Energy Monitor; Global Fishing Watch/emLab; Johns Hopkins University Applied Physics Lab; OceanMind; RMI; TransitionZero; and WattTime. Climate TRACE is also supported by more than 100 other contributing organizations and researchers, including key data and analysis contributors: Arboretica, Michigan State University, Ode Partners, Open Supply Hub, Saint Louis University's Remote Sensing Lab, and University of Malaysia Terengganu. For more information about the coalition and a list of contributors, click here.
Media Contacts
Fae Jencks and Nikki Arnone for Climate TRACE