Climate TRACE Releases June 2025 Emissions Data
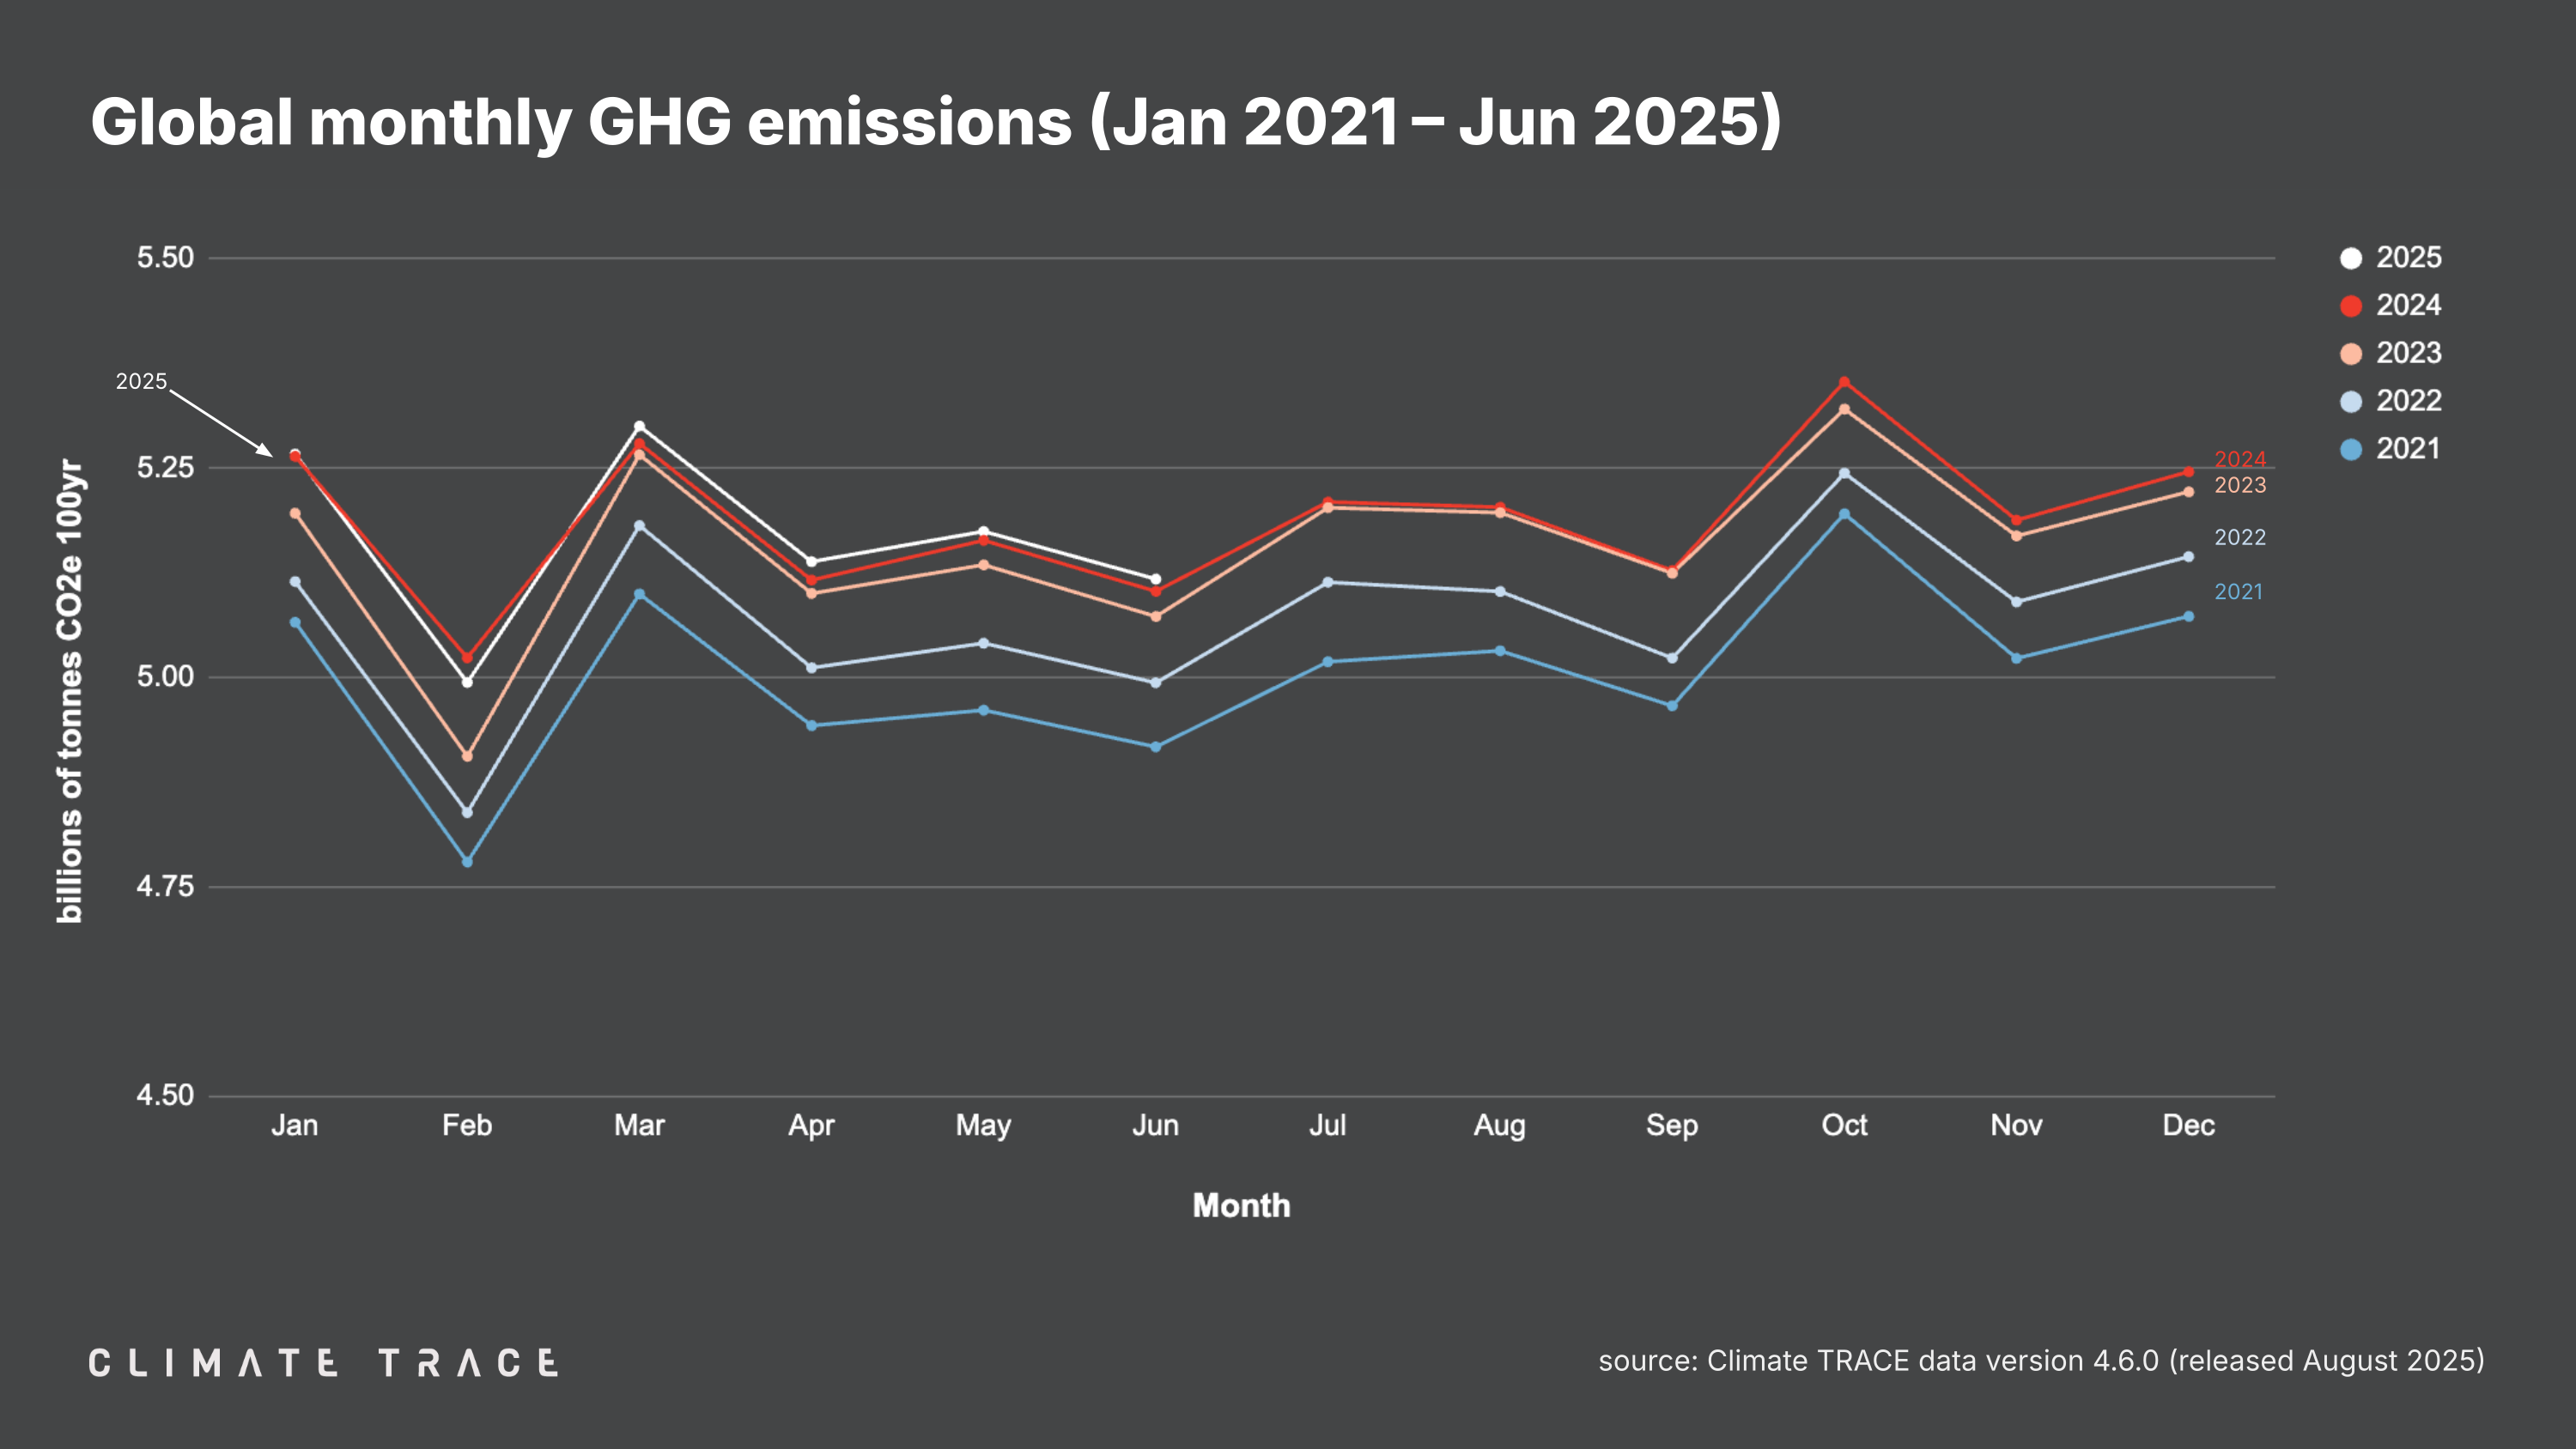
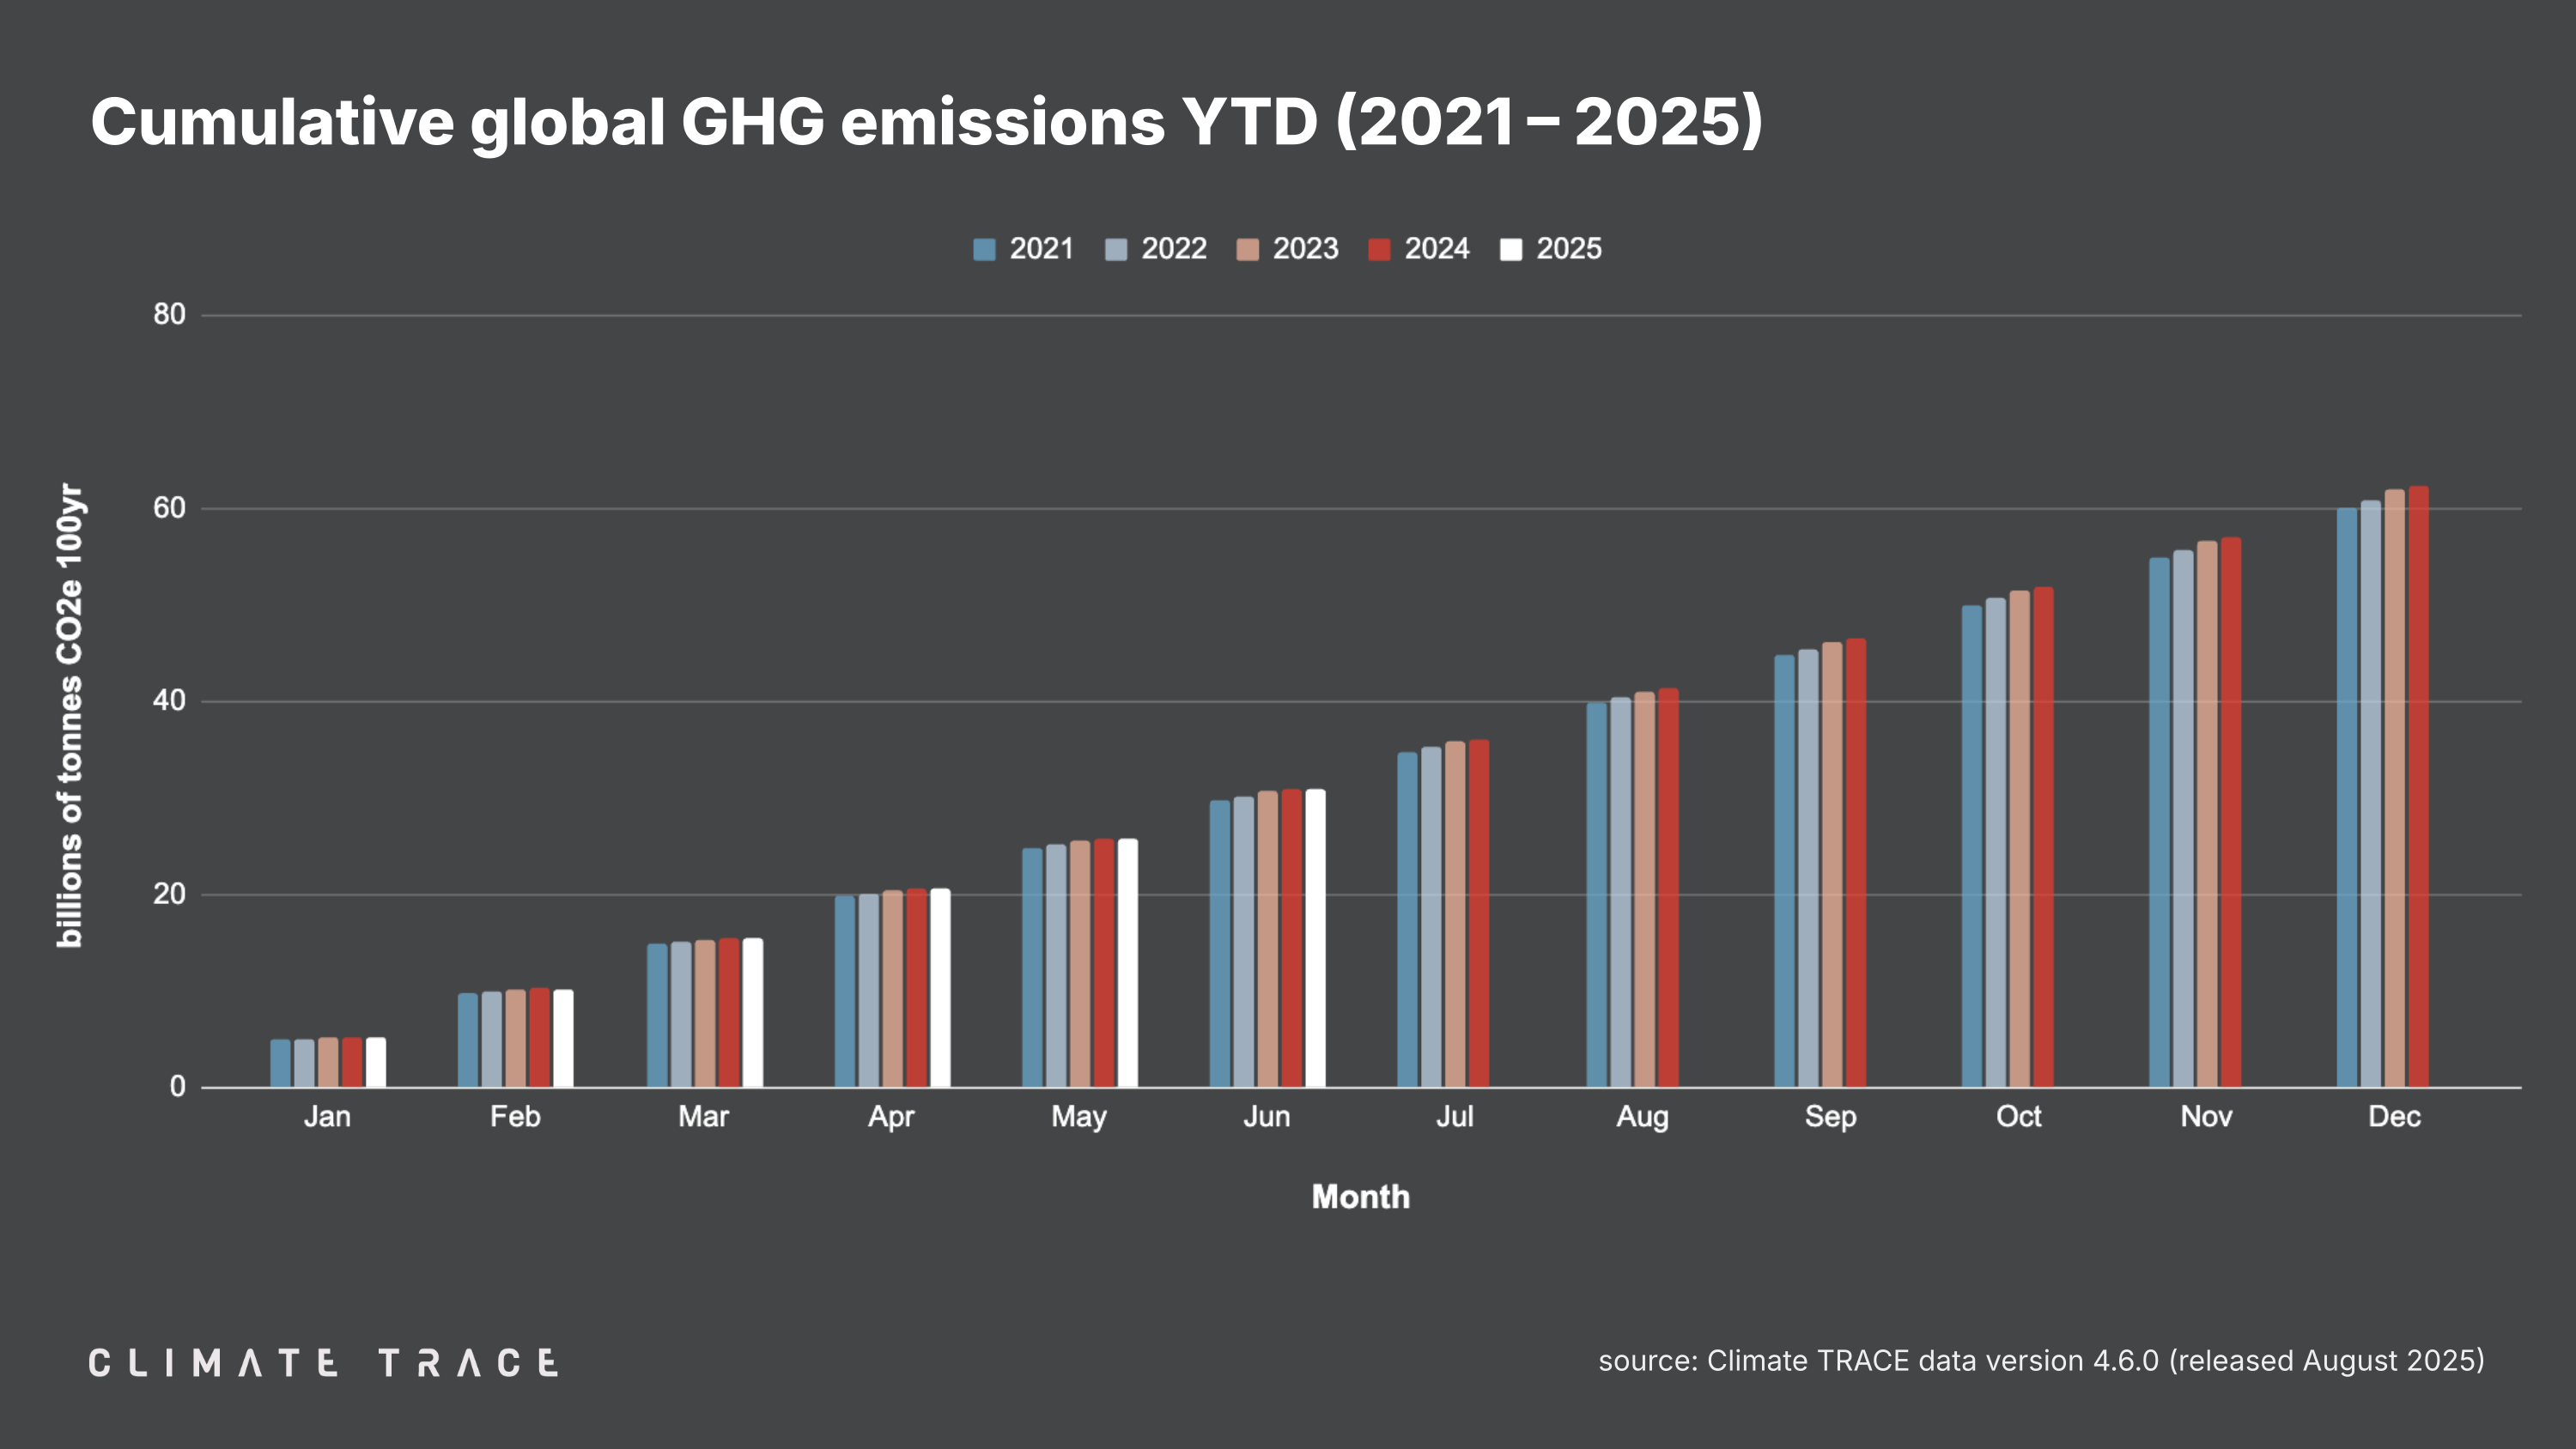
August 28, 2025 – Today, Climate TRACE reported that total global emissions in the first half of 2025 are 30.99 billion tonnes CO₂e. This is 0.13% higher than emissions were in the first half of 2024. Global greenhouse gas emissions for the month of June 2025 totaled 5.12 billion tonnes CO₂e. This represents an increase of 0.29% vs. June 2024. Global methane emissions in June 2025 were 34.82 million tonnes CH₄, an increase of 0.49% vs. June 2024.
Data tables summarizing emissions totals for June 2025 by sector, country, and top 100 urban areas are available for download here.
Lookback: Global Greenhouse Gas Emissions for the First Half of 2025
In the first half of 2025, the sector driving the most growth in emissions was fossil fuel operations, where emissions rose by 1.5% (an increase of 77.65 million tonnes of CO₂e). The United States accounted for more than half of that increase. Manufacturing emissions also rose in the first half of 2025, growing by 0.3% (an increase of 18.75 million tonnes of CO₂e), led by increases in India, Vietnam, Indonesia, and Brazil.
Meanwhile, global power sector emissions saw the biggest decline in the first half of 2025, falling by 0.8% (a decrease of 60.27 million tonnes of CO₂e), driven almost entirely by declines in China and India, where power emissions were 1.7% lower and 0.8% lower than their totals in the first half of 2024, respectively.
The first half of 2025 shows small but positive progress on decarbonization in China, Mexico, and Australia. China’s emissions decreased 45.37 million tonnes CO₂e, or 0.51% compared to the first half of 2024. Mexico’s emissions decreased 7.78 million tonnes CO₂e, or 1.71% compared to the first half of 2024. Australia’s emissions decreased 6.56 million tonnes CO₂e, or 1.51% compared to the first half of 2024. However, some of the world’s other major emitting economies, including the United States, India, the EU, Indonesia, and Brazil, saw emissions rise in the first half of 2025.
– United States emissions increased by 48.57 million tonnes CO₂e, or 1.43% compared to the first half of 2024;
– India emissions increased by 4.44 million tonnes CO₂e, or 0.21% compared to the first half of 2024;
– European Union emissions increased by 2.90 million tonnes CO₂e, or 0.15% compared to the first half of 2024.
– Indonesia emissions increased by 3.06 million tonnes CO₂e, or 0.39% compared to the first half of 2024;
– Brazil emissions increased by 9.84 million tonnes CO₂e, or 1.24% compared to the first half of 2024.
Greenhouse Gas Emissions by Country: June 2025
Climate TRACE’s preliminary estimate of June 2025 emissions in China, the world’s top emitting country, is 1.46 billion tonnes CO₂e — an increase of 0.92 million tonnes of CO₂e or 0.06% vs. June 2024.
Of the other top five emitting countries:
– United States emissions increased by 4.89 million tonnes CO₂e, or 0.86% year over year;
– India emissions declined by 0.11 million tonnes CO₂e, or 0.03% year over year;
– Russia emissions increased by 0.95 million tonnes CO₂e, or 0.38% year over year;
– Indonesia emissions increased by 0.43 million tonnes CO₂e, or 0.33% year over year.
In the EU, which as a bloc would be the fourth largest source of emissions in June 2025, emissions declined by 1.80 million tonnes CO₂e compared to June 2024, or 0.58%.
Greenhouse Gas Emissions by Sector: June 2025
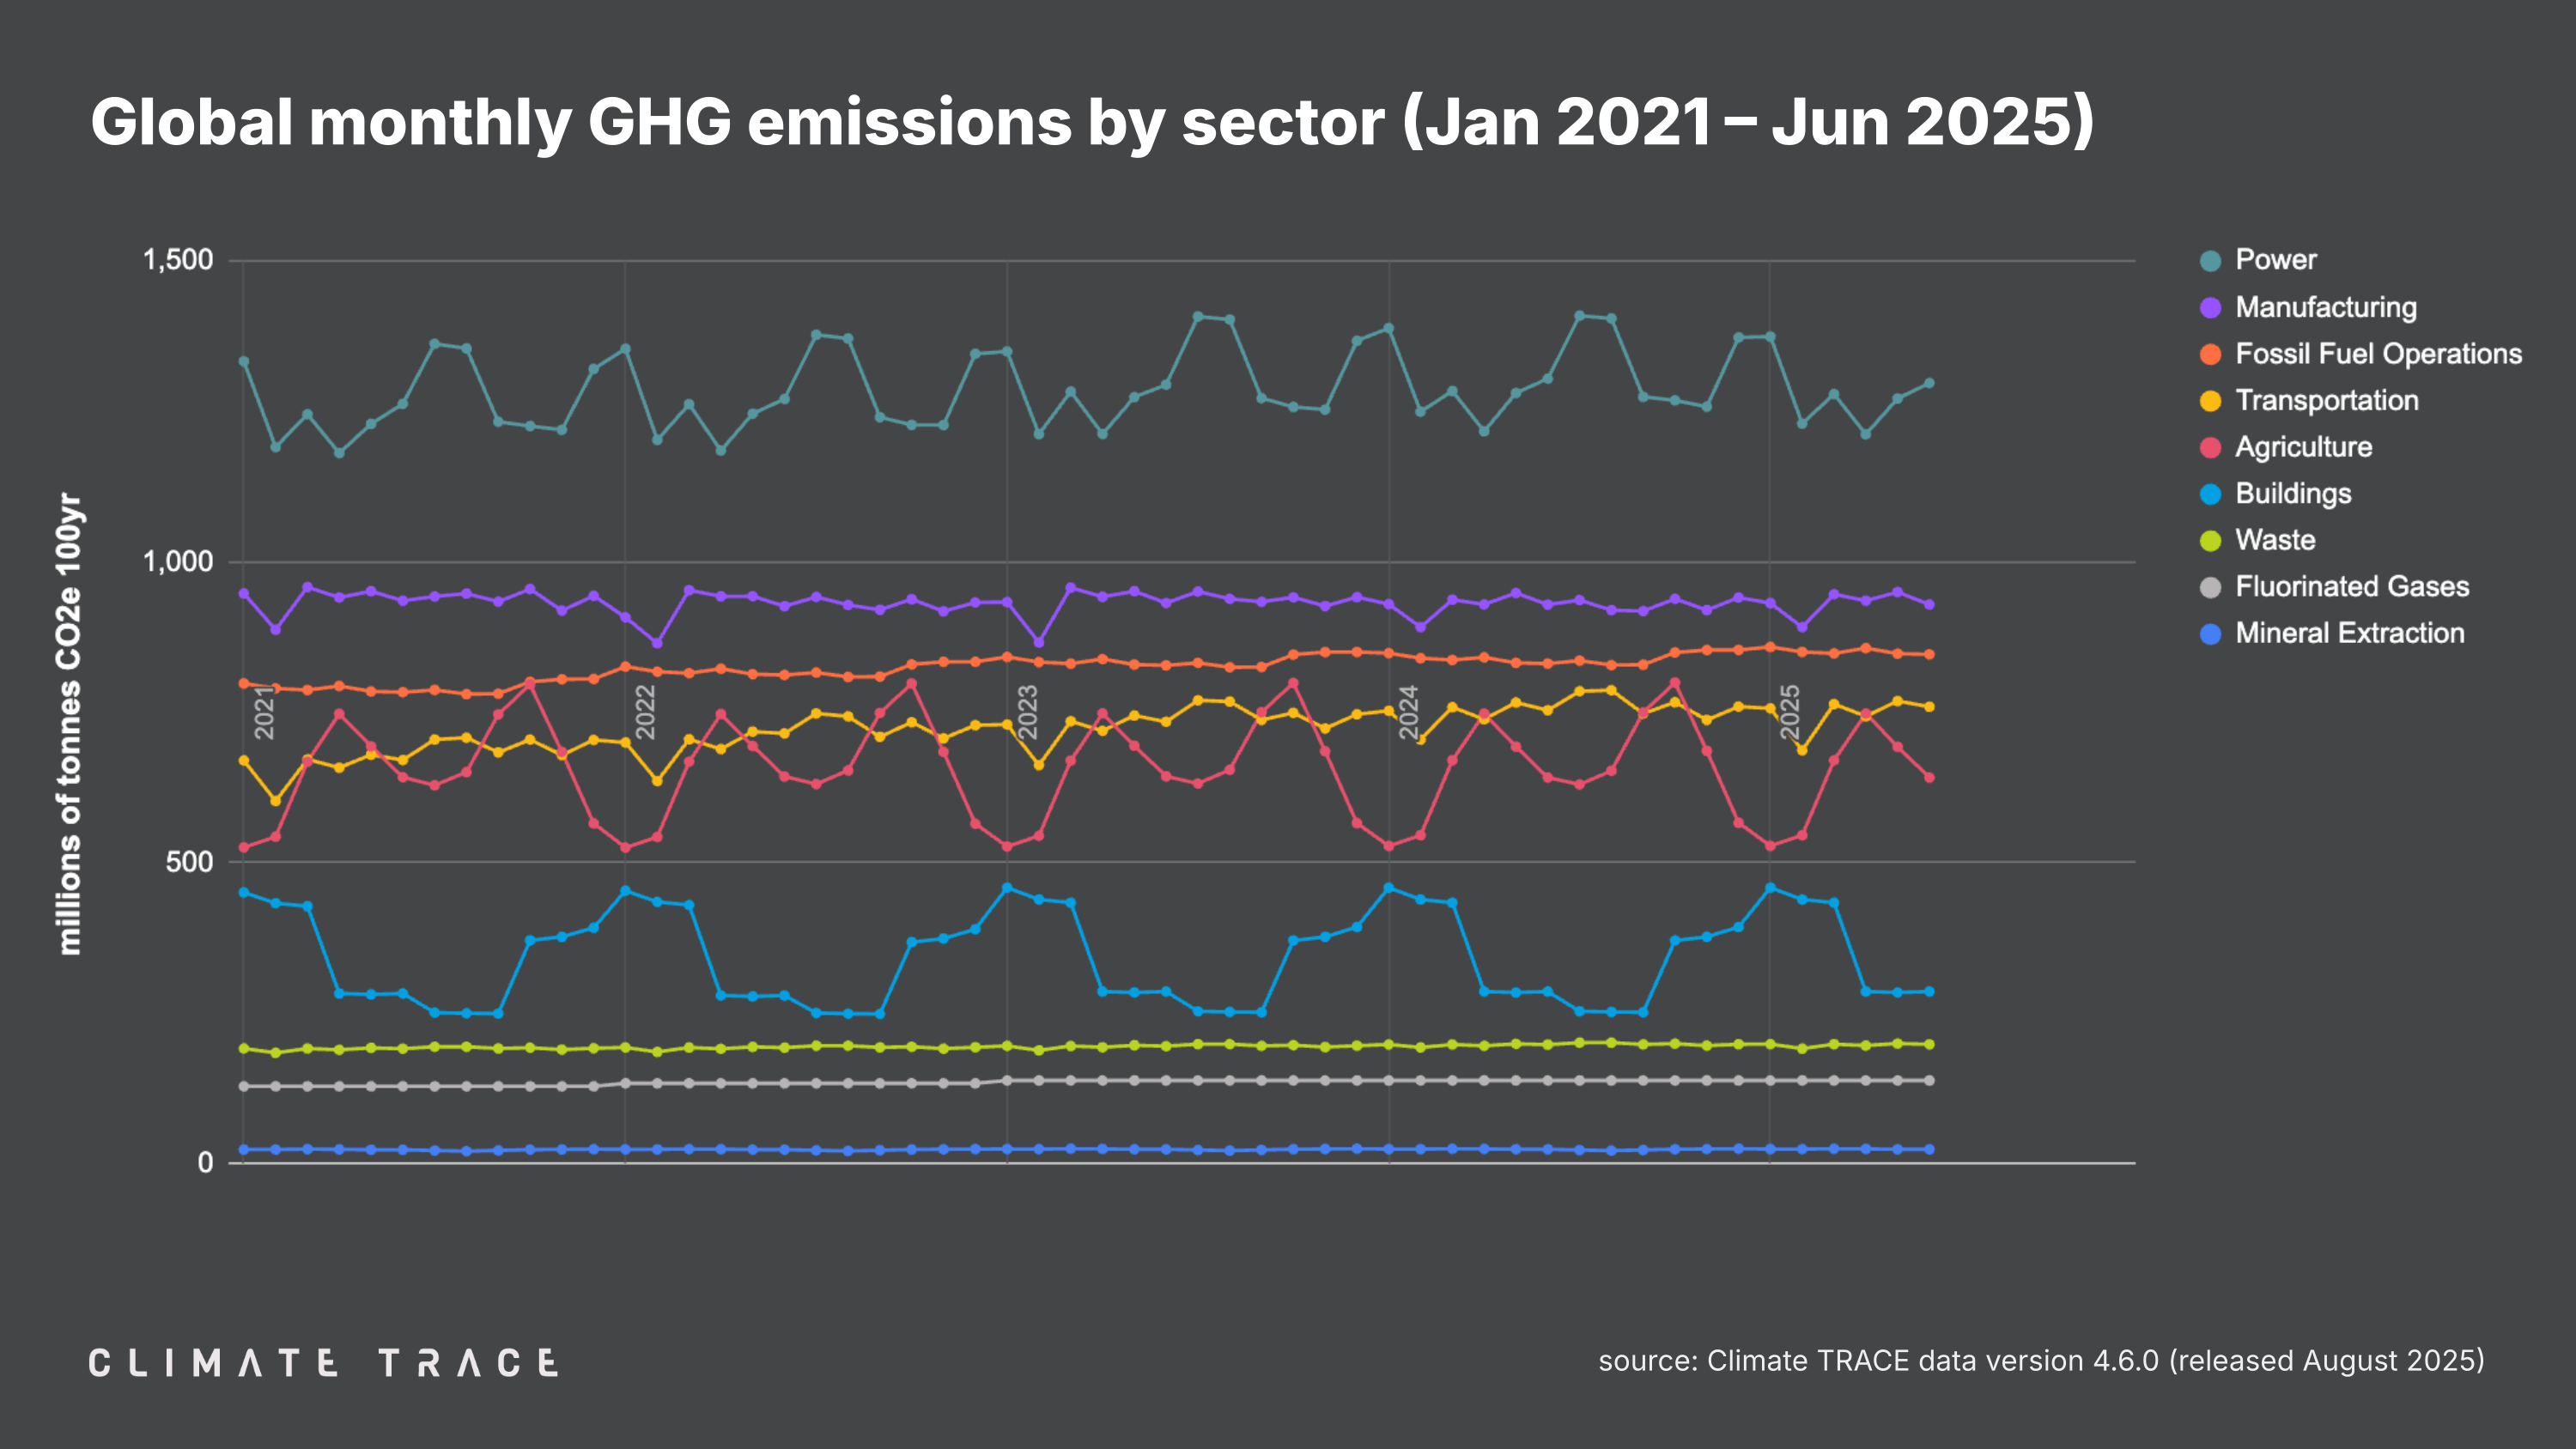
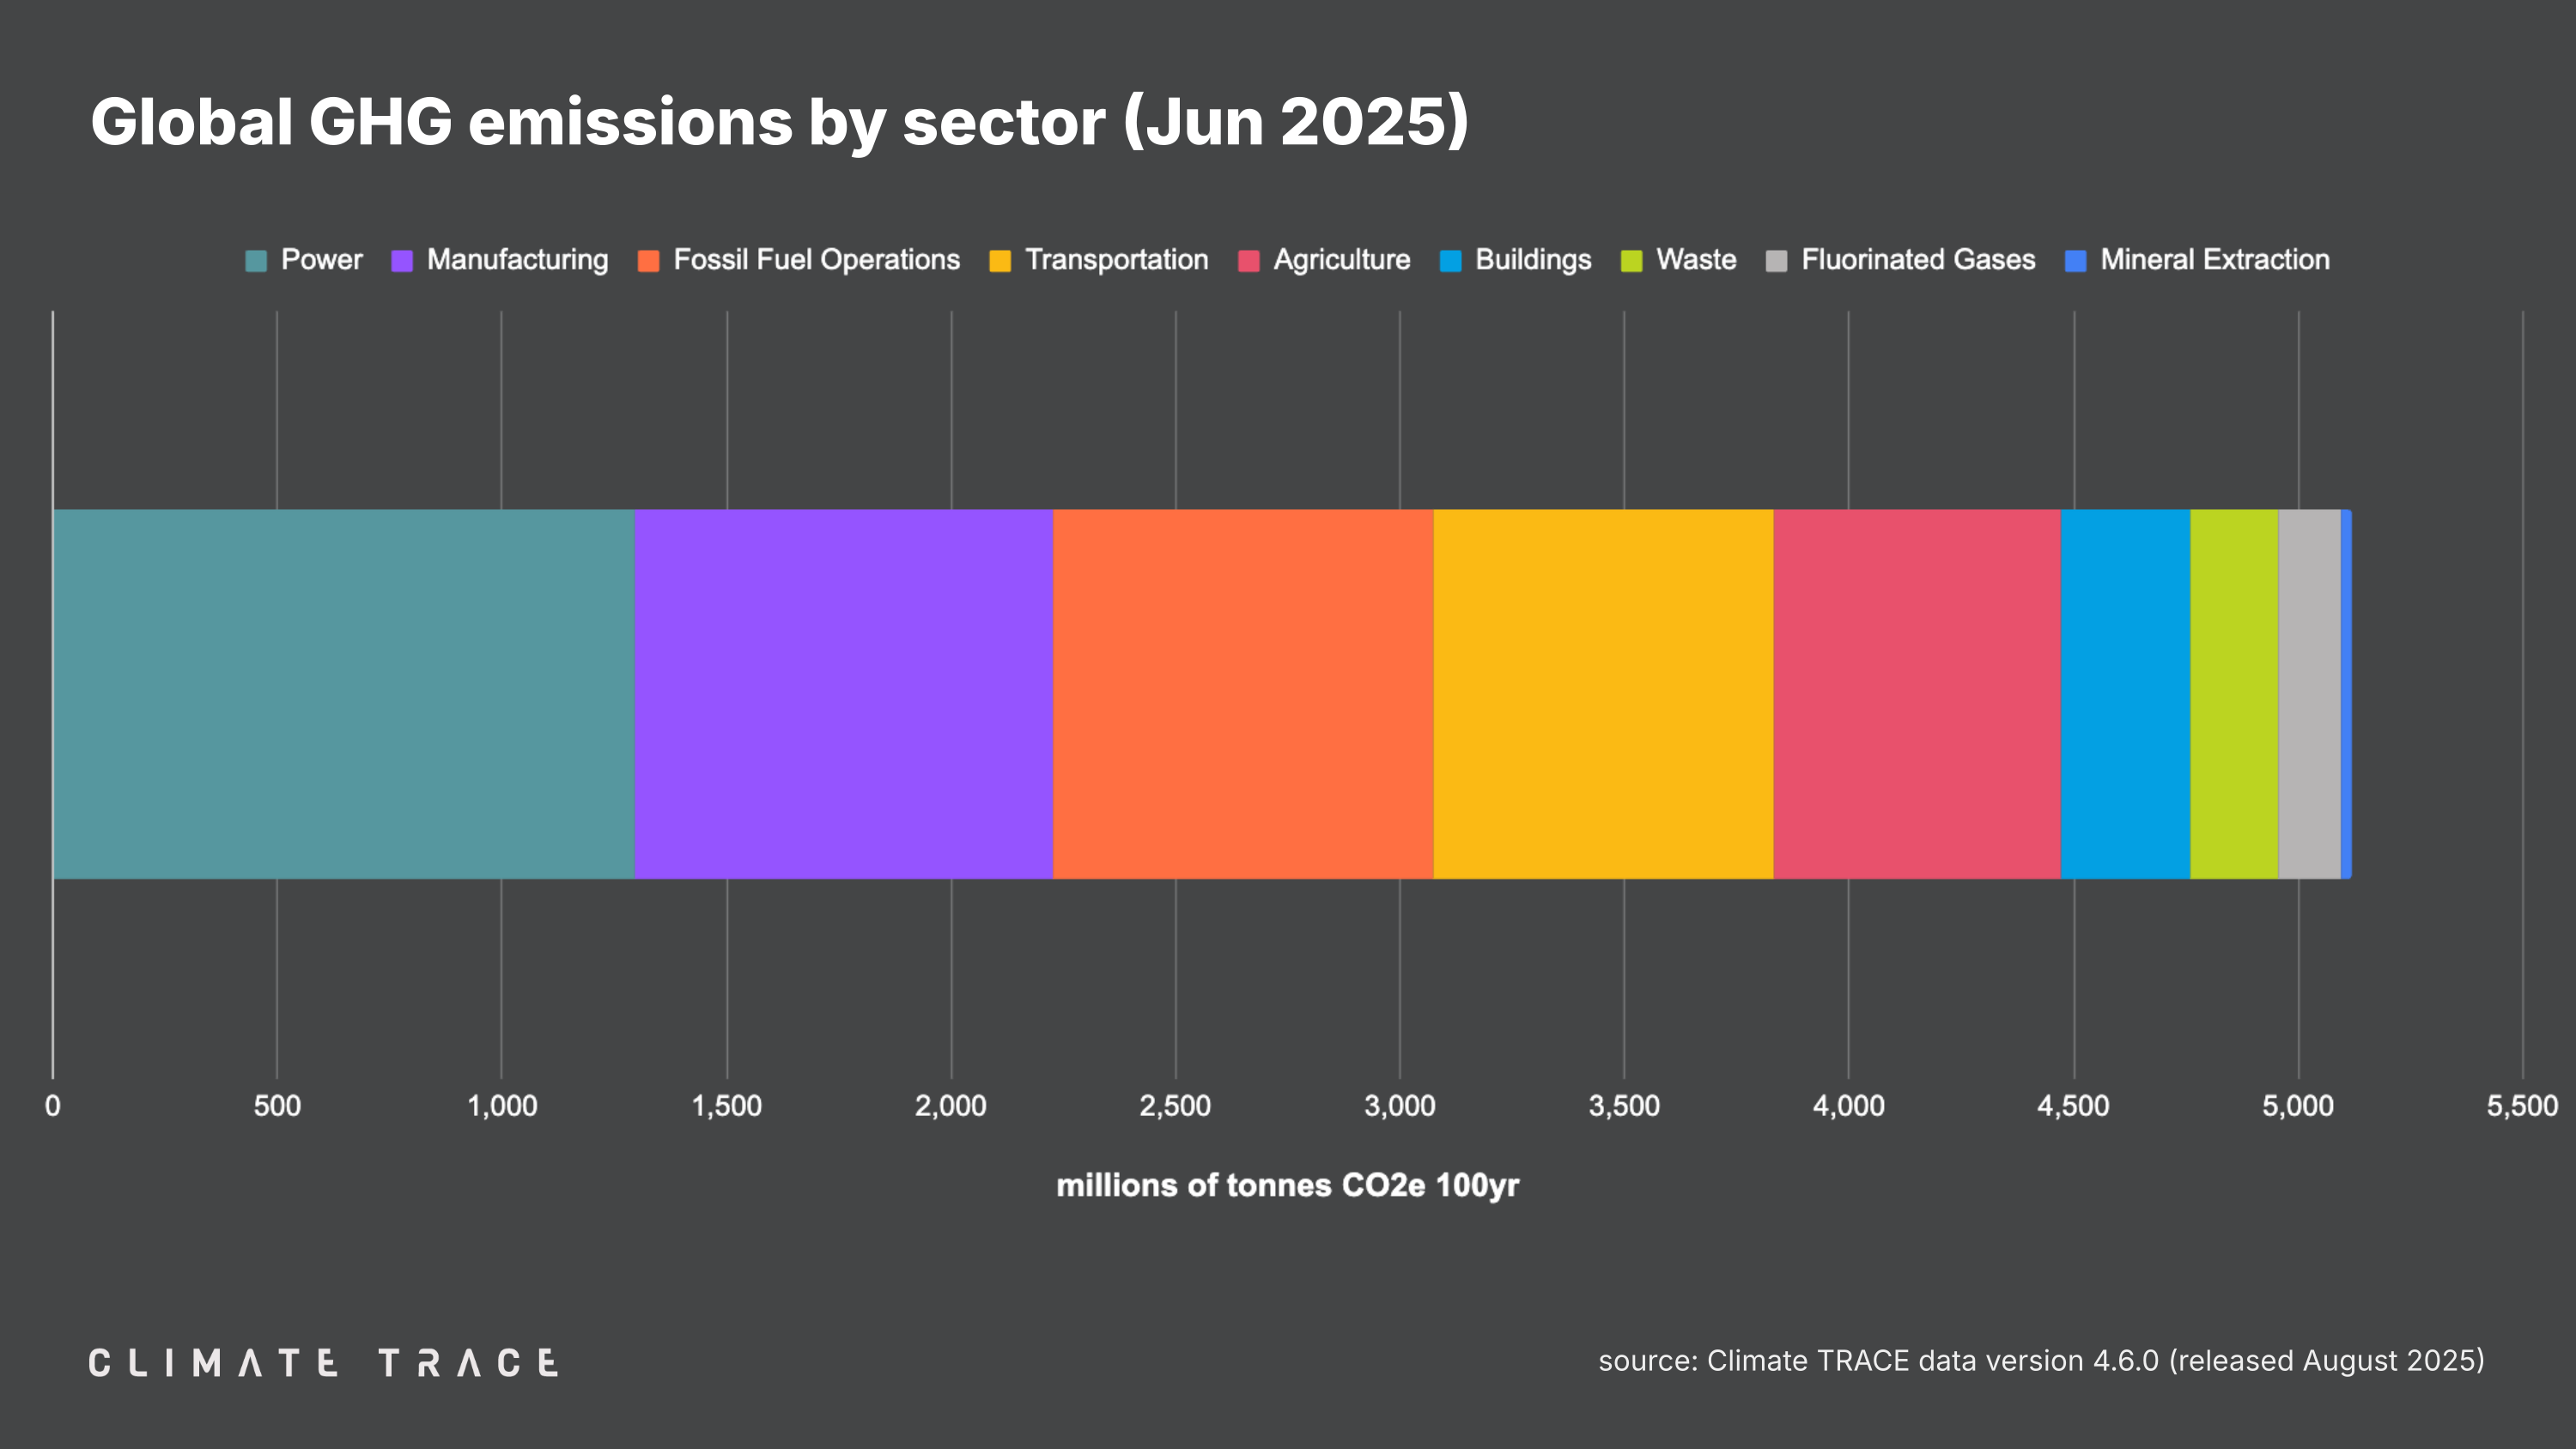
Greenhouse gas emissions increased in June 2025 vs. June 2024 in fossil fuel operations, manufacturing, transportation, and waste, and decreased in power. Fossil fuel operations saw the greatest change in emissions year over year, with emissions increasing by 1.85% as compared to June 2024.
– Agriculture emissions were 641.40 million tonnes CO₂e, unchanged vs. June 2024;
– Buildings emissions were 285.59 million tonnes CO₂e, unchanged vs. June 2024;
– Fluorinated gases emissions were 137.71 million tonnes CO₂e, unchanged vs. June 2024;
– Fossil fuel operations emissions were 846.19 million tonnes CO₂e, a 1.85% increase vs. June 2024;
– Manufacturing emissions were 929.05 million tonnes CO₂e, a 0.02% increase vs. June 2024;
– Mineral extraction emissions were 23.22 million tonnes CO₂e, unchanged vs. June 2024;
– Power emissions were 1,297.34 million tonnes CO₂e, a 0.56% decrease vs. June 2024;
– Transportation emissions were 759.10 million tonnes CO₂e, a 0.77% increase vs. June 2024;
– Waste emissions were 197.77 million tonnes CO₂e, a 0.26% increase vs. June 2024.
Greenhouse Gas Emissions by City: June 2025
The urban areas with the highest total greenhouse gas emissions in June 2025 were Shanghai, China; Tokyo, Japan; New York, United States; Houston, United States; and Los Angeles, United States.
The urban areas with the greatest increase in absolute emissions in June 2025 as compared to June 2024 were Pittsburgh, United States; Xinyu, China; Tokyo, Japan; Baotou, China; and Algeciras, Spain. Those with the largest absolute emissions decline between this June and last June were Leipzig, Germany; Anqing, China; Duren, Germany; Houston, United States; and Anchorage, United States.
The urban areas with the greatest increase in emissions as a percentage of their total emissions were Kombissiri, Burkina Faso; Gambat, Pakistan; Bitilta Zebraro, Ethiopia; UNNAMED, Sudan; and Oviedo, Spain. Those with the greatest decrease by percentage were Leipzig, Germany; Duren, Germany; Wolfsburg, Germany; Atebubu, Ghana; and Evansville, United States.
RELEASE NOTES
Revisions to existing Climate TRACE data are common and expected. They allow us to take the most up-to-date and accurate information into account. As new information becomes available, Climate TRACE will update its emissions totals (potentially including historical estimates) to reflect new data inputs, methodologies, and revisions.
With the addition of June 2025 data, the Climate TRACE database is now updated to version V4.6.0. This release incorporates the most recent FAOSTAT and CEDS data in applicable sectors. The release also reflects updated methodology for non-GHG emissions from glass, cement, and lime production; the addition of N2O emissions across agriculture subsectors and additional refinements to agriculture emissions factors; updated North America and Europe data for Q4 2024 in petrochemicals and oil and gas refining; updated methodology and data for cement and steel production to reflect updated emissions factors; and the addition of 56 steel plants to our database.
A detailed description of data updates is available in our changelog here.
To learn more about what is included in our monthly data releases and for frequently asked questions, click here. All methodologies for Climate TRACE data estimates are available to view and download here. For any further technical questions about data updates, please contact: coalition@ClimateTRACE.org.
To sign up for monthly updates from Climate TRACE, click here.
Emissions data for July 2025 are scheduled for release on September 25, 2025.
About Climate TRACE
The Climate TRACE coalition was formed by a group of AI specialists, data scientists, researchers, and nongovernmental organizations. Current members include Carbon Yield; CTrees; Duke University’s Nicholas Institute for Energy, Environment & Sustainability; Earth Genome; Former Vice President Al Gore; Global Energy Monitor; Hypervine.io; Johns Hopkins University Applied Physics Lab; OceanMind; RMI; TransitionZero; and WattTime. Climate TRACE is also supported by more than 100 other contributing organizations and researchers, including key data and analysis contributors: Arboretica, Carnegie Mellon University’s CREATE Lab, Global Fishing Watch/emLab, Michigan State University, Open Supply Hub, and University of Malaysia Terengganu. For more information about the coalition and a list of contributors, click here.
Media Contacts
Fae Jencks and Nikki Arnone for Climate TRACE