Universiti Malaysia Terengganu’s Rudiyanto on the importance — and complexity — of modeling rice emissions
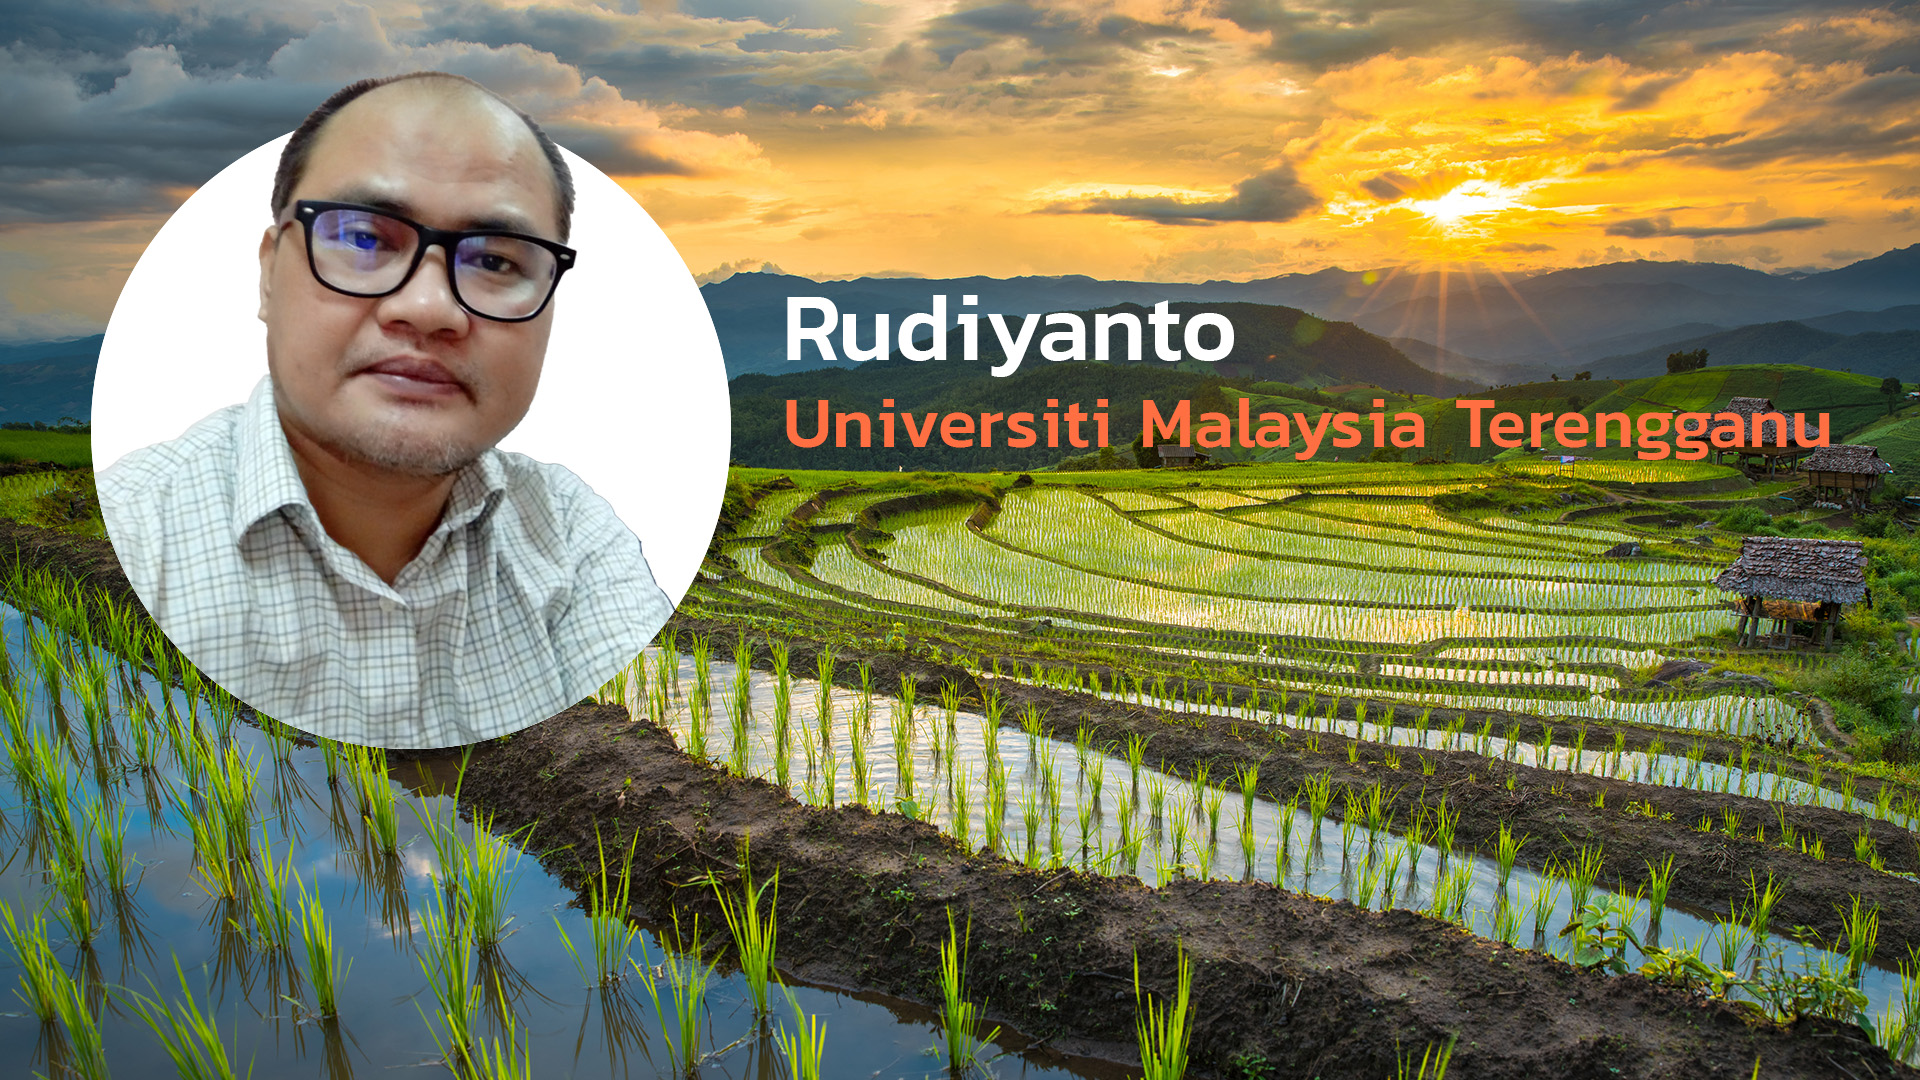
As part of an ongoing Climate TRACE series, we are interviewing individual coalition members about their work. We recently talked with Rudiyanto, a lecturer at Universiti Malaysia Terengganu, where he supports Climate TRACE’s work on modeling emissions from rice cultivation.
You map and estimate methane emissions from rice cultivation. Why is this field of study important?
Understanding methane emissions from rice is important because methane is a powerful greenhouse gas — about 80 times more potent than CO₂ over a 20-year time frame. Rice fields are a major source of these emissions, which are released when rice is grown in flooded paddies, where standing water creates low-oxygen conditions that allow microbes called methanogens to break down organic matter in the soil. Rice is also a staple food for billions of people worldwide — over half the world's population depends on it for most of their food needs — making it essential for global food security.
That methane-producing process, along with the vast scale of production needed globally, makes rice cultivation the second-largest agricultural source after livestock — accounting for roughly 10–12 percent of agricultural methane emissions. Given this significant contribution, modeling rice production emissions is crucial for tackling the sector's climate impact.
Why is it difficult to get an accurate picture of these emissions?
One of the main reasons it is difficult is the spatial and temporal variability involved. Many current estimates rely on agricultural statistics aggregated at the national level, which are often outdated, generalized, and can contain errors — like under- or over-reporting the actual rice area. We don’t get a clear picture of when and where rice is actually grown, and the data might be several years old. That's not useful when emissions can change from season to season or field to field.
How does your team estimate emissions more precisely? What’s your approach?
We start with a relatively simple approach based on the IPCC formula. The methane emissions are calculated by multiplying the annual harvested area and the emissions factor. So we have two main components: the activity data, which is the annual harvested area, and the emissions factor for each country or region.
For many countries, especially in Southeast Asia, farmers plant rice two or three times per year in the same field. So we extend the basic formula to account for multiple seasons, with each term representing a different cropping season with its own area and emissions factor (EF):
Annual Emissions = (Area₁ × EF₁) + (Area₂ × EF₂) + (Area₃ × EF₃)
To determine the harvested areas for different seasons, we use remote sensing technology. In the past, we used MODIS data with 500-meter spatial resolution, but from 2021 onward, we improved to 10-meter spatial resolution using Sentinel-1 radar data and Sentinel-2 optical data. Sentinel-1 is independent from clouds, though it has more noise, while Sentinel-2 gives clearer images but has cloud cover problems. We combine both to get the advantages of each platform.
For emissions factors, we collect data from published literature. From 2015 to 2021, we used national emissions factors, but for 2022 and 2023, we developed more detailed subnational factors for China, Vietnam, and Thailand to capture how emissions factors vary by season and region, reflecting differences in agricultural practices and environmental conditions.
What are some of the biggest challenges you've faced — and how have you worked around them?
We face several major challenges. First, estimating harvested area is difficult because smallholder rice fields, especially in Southeast Asia and Africa, are very small and fragmented. Our 10-meter resolution satellite imagery makes it hard to detect these fields, particularly in Africa where they are widely scattered.
Another challenge is computation time. While 10-meter resolution is the highest resolution practical for large-scale regional mapping, it creates substantial computational demands when mapping farms across large regions over multiple years.
To address these challenges, we've implemented an automated classification workflow in Google Earth Engine using time series analysis. We also divide countries into small grids — for example, in Nigeria we have almost 300 grids that we check one by one. Google Street View has been very helpful for this because we can identify where rice is actually planted. This is especially useful in Africa where publication data is limited.
For emissions factors, we face high uncertainty due to limited ground-truth methane observations and sparse in-situ data, especially in Africa and parts of Asia. There's also a mismatch in resolution between emission factor maps and our high-resolution harvested area maps. We've addressed this by collecting more published datasets to enhance our emissions factor models and applying spatial downscaling techniques.
Over time, we've refined our approach by moving from national to sub-national emissions factors, and now we're developing spatial modeling to predict emissions factors at the pixel level based on environmental factors like soil, vegetation, temperature, and climate using machine learning.
How can these data inform emissions-reduction target setting, strategies, and measurement? For whom?
These high-resolution, spatially explicit data can support multiple stakeholders. Currently, organizations like FAO, USDA, and national departments of agriculture mostly provide only tabulated data without spatial detail. We don't know where and when rice is cultivated from their reports. Our maps of rice intensity, harvested area, and cropping calendars can complement their current data collection.
For national-level reporting under agreements like the UNFCCC, this helps countries move from Tier 1 to Tier 2 or 3 reporting, improving accuracy of national GHG inventories. For subnational and policy planning, it supports regional climate action plans by identifying high-emissions zones and enabling targeted outreach and incentives for sustainable practices.
These data are also valuable for climate finance and measurement, reporting, and verification systems. Understanding rice production’s methane emissions enables transparent monitoring for climate finance programs and carbon market participation.
All this empowers stakeholders at all levels — from governments to the private sector — to set more targeted, evidence-based emissions reduction goals. Our hope is that if we can make these data more widely available, it can be utilized by anyone who needs it.
This interview has been edited for length and clarity. Interviewed by Daisy Simmons.