Climate TRACE Data Show Marginal Increase in Global Emissions in the First Half of 2026
The newest data release provides early insight into the greenhouse gas impacts of disruptions to energy markets, and uneven progress in decarbonization.
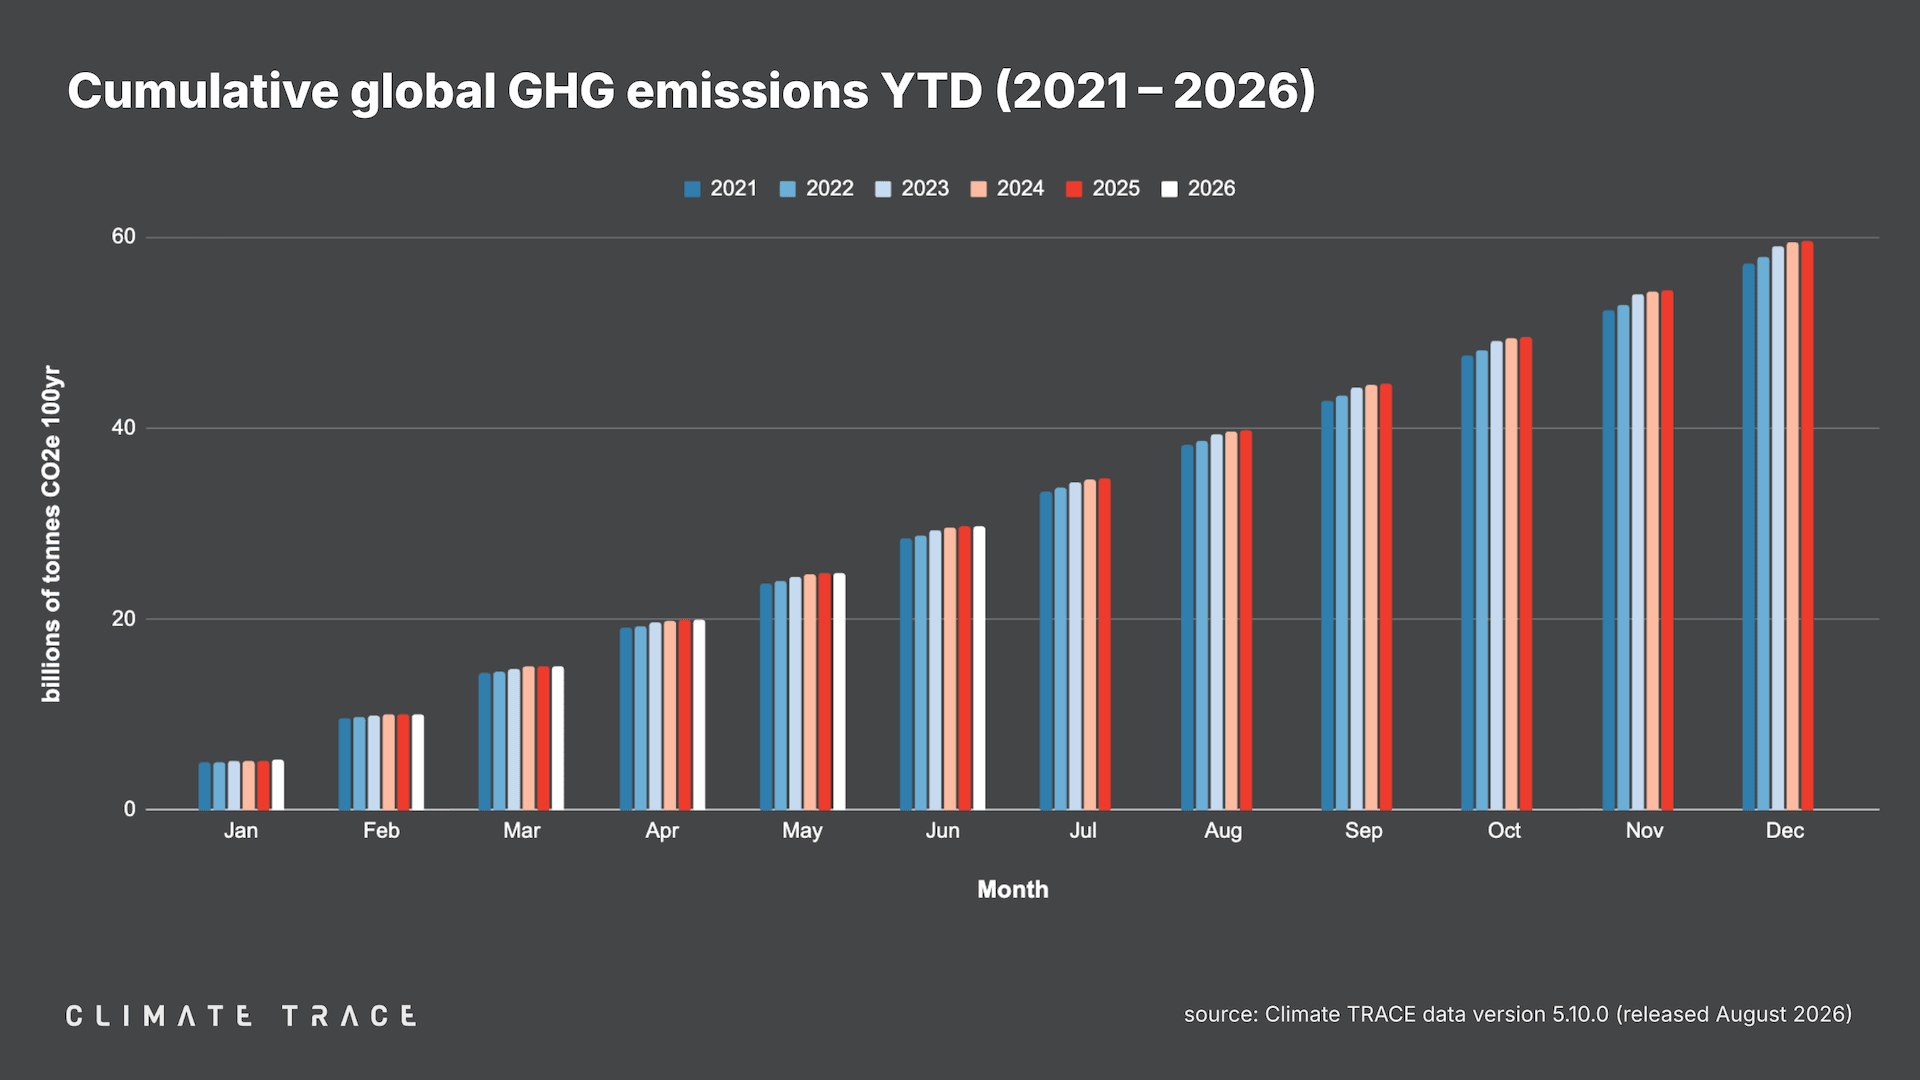
August 27, 2026 -- Today, Climate TRACE released June 2026 greenhouse gas (GHG) emissions data, and reported that global GHG emissions for the first half of 2026 were 0.2% higher than in the first half of 2025. Climate TRACE's preliminary estimate of total global year-to-date emissions is 29.7 billion tonnes CO₂e. The data show that progress toward decarbonization is occurring unevenly across countries and sectors.
Key Insights
-
Global greenhouse gas emissions increased marginally in the first half of 2026, rising 0.2% compared with the first half of 2025.
-
The largest growth in emissions came from transportation, specifically road transportation. Declines in emissions from power, manufacturing, and shipping helped limit the global increase in GHGs.
-
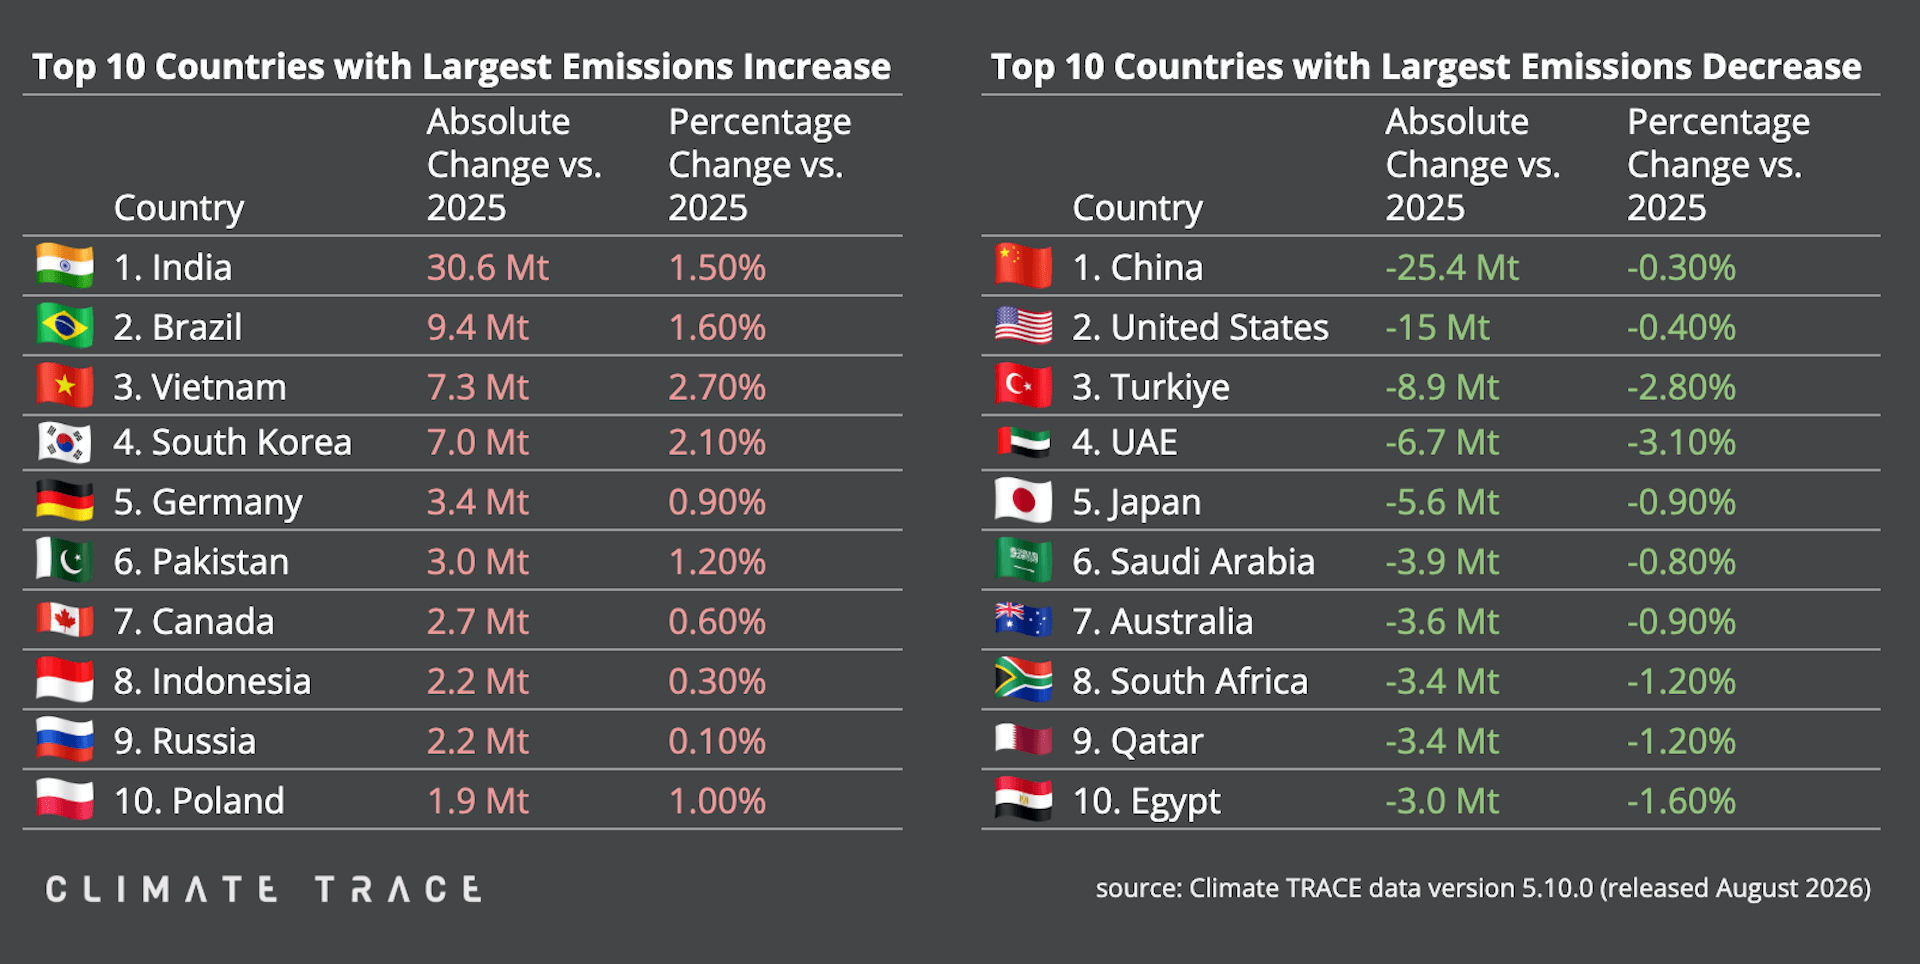
Notably, emissions declined slightly in the two largest emitting countries, China and the United States, while India and Brazil saw the biggest increases in absolute emissions in the first half of the year, effectively canceling out the gains made in China and the US.
-
Power sector emissions declined, despite concern that disruptions in oil and gas markets would push countries to utilize more coal for electricity generation. Shipping emissions also declined, likely due to impacts from the closure of the Strait of Hormuz.
Lookback: Global Greenhouse Gas Emissions in the First Half of 2026
Global emissions increased marginally
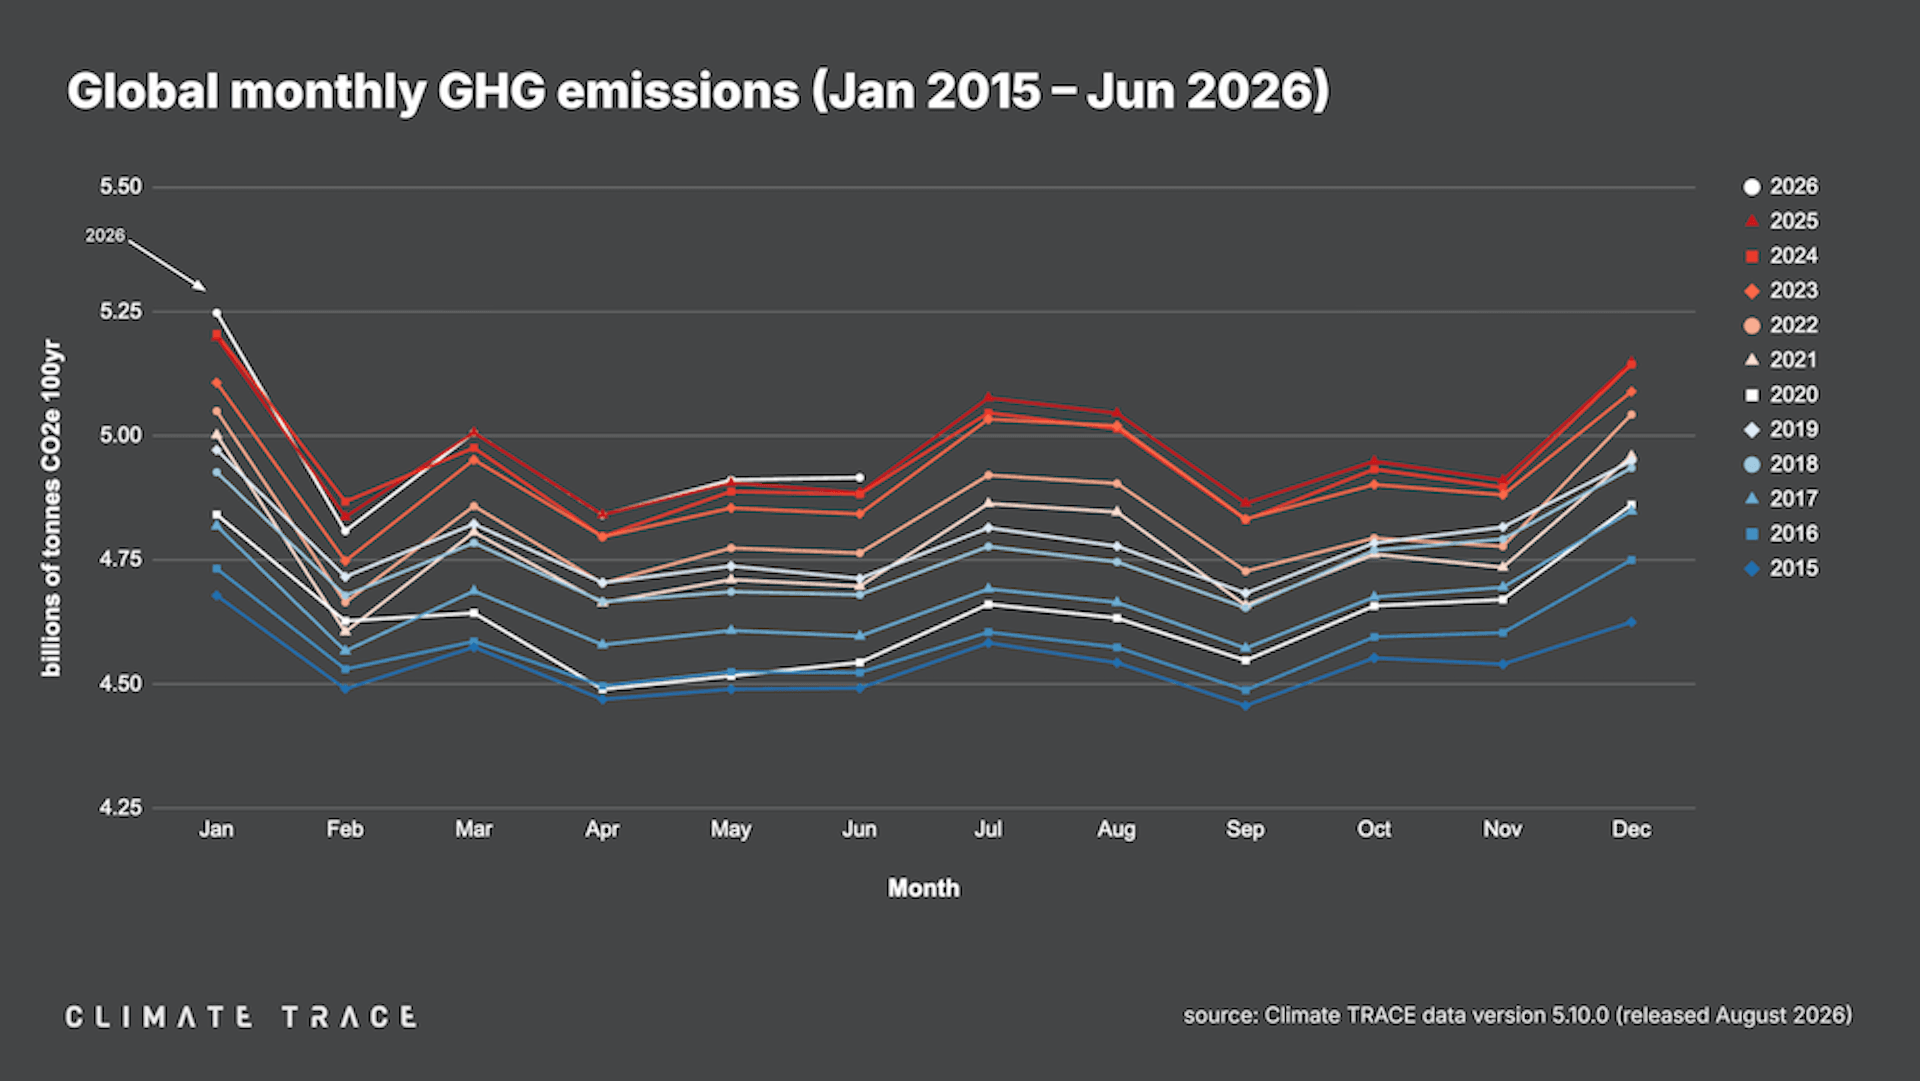
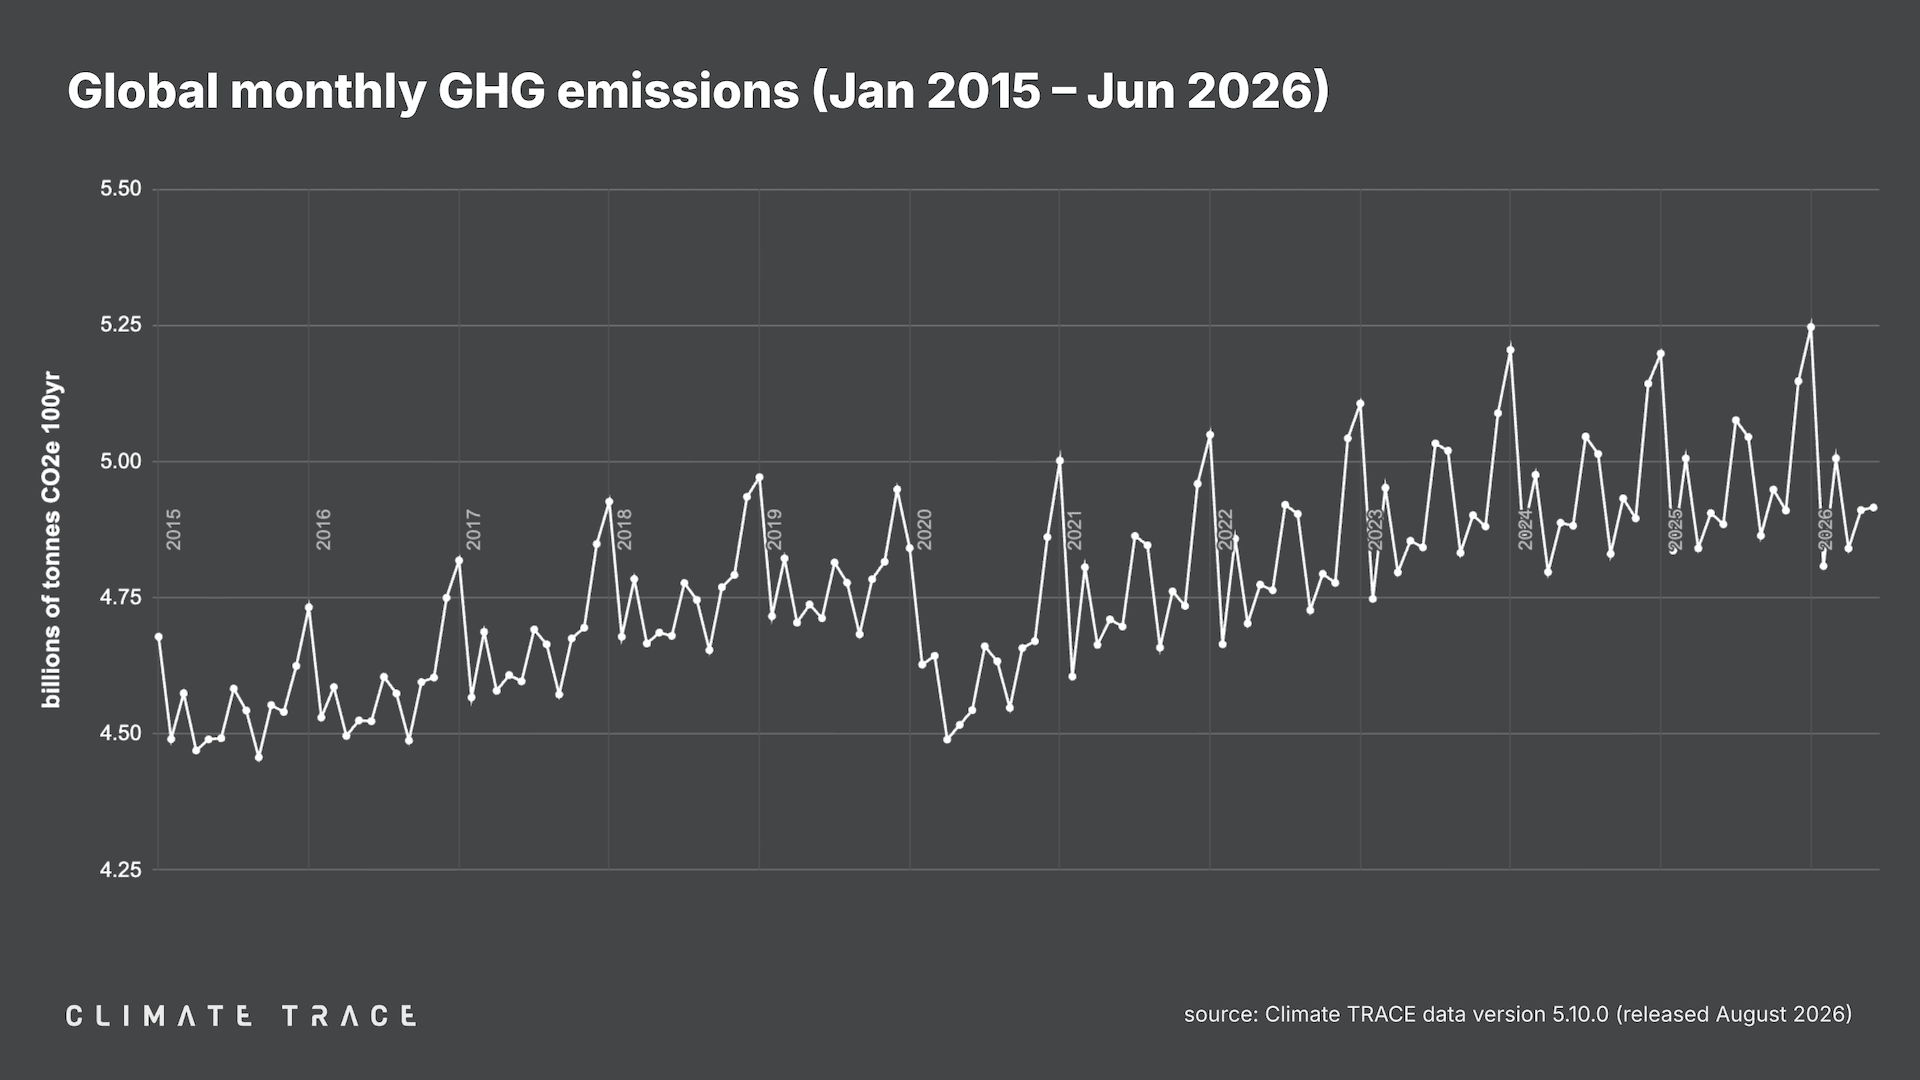
Climate TRACE’s preliminary estimates for the first half of 2026 show that global greenhouse gas emissions increased marginally in the first half of 2026, rising by 56.4 million tonnes of CO₂e, 0.2% higher than in the first half of 2025.
Road transportation was the largest driver of emissions growth in the first half of 2026
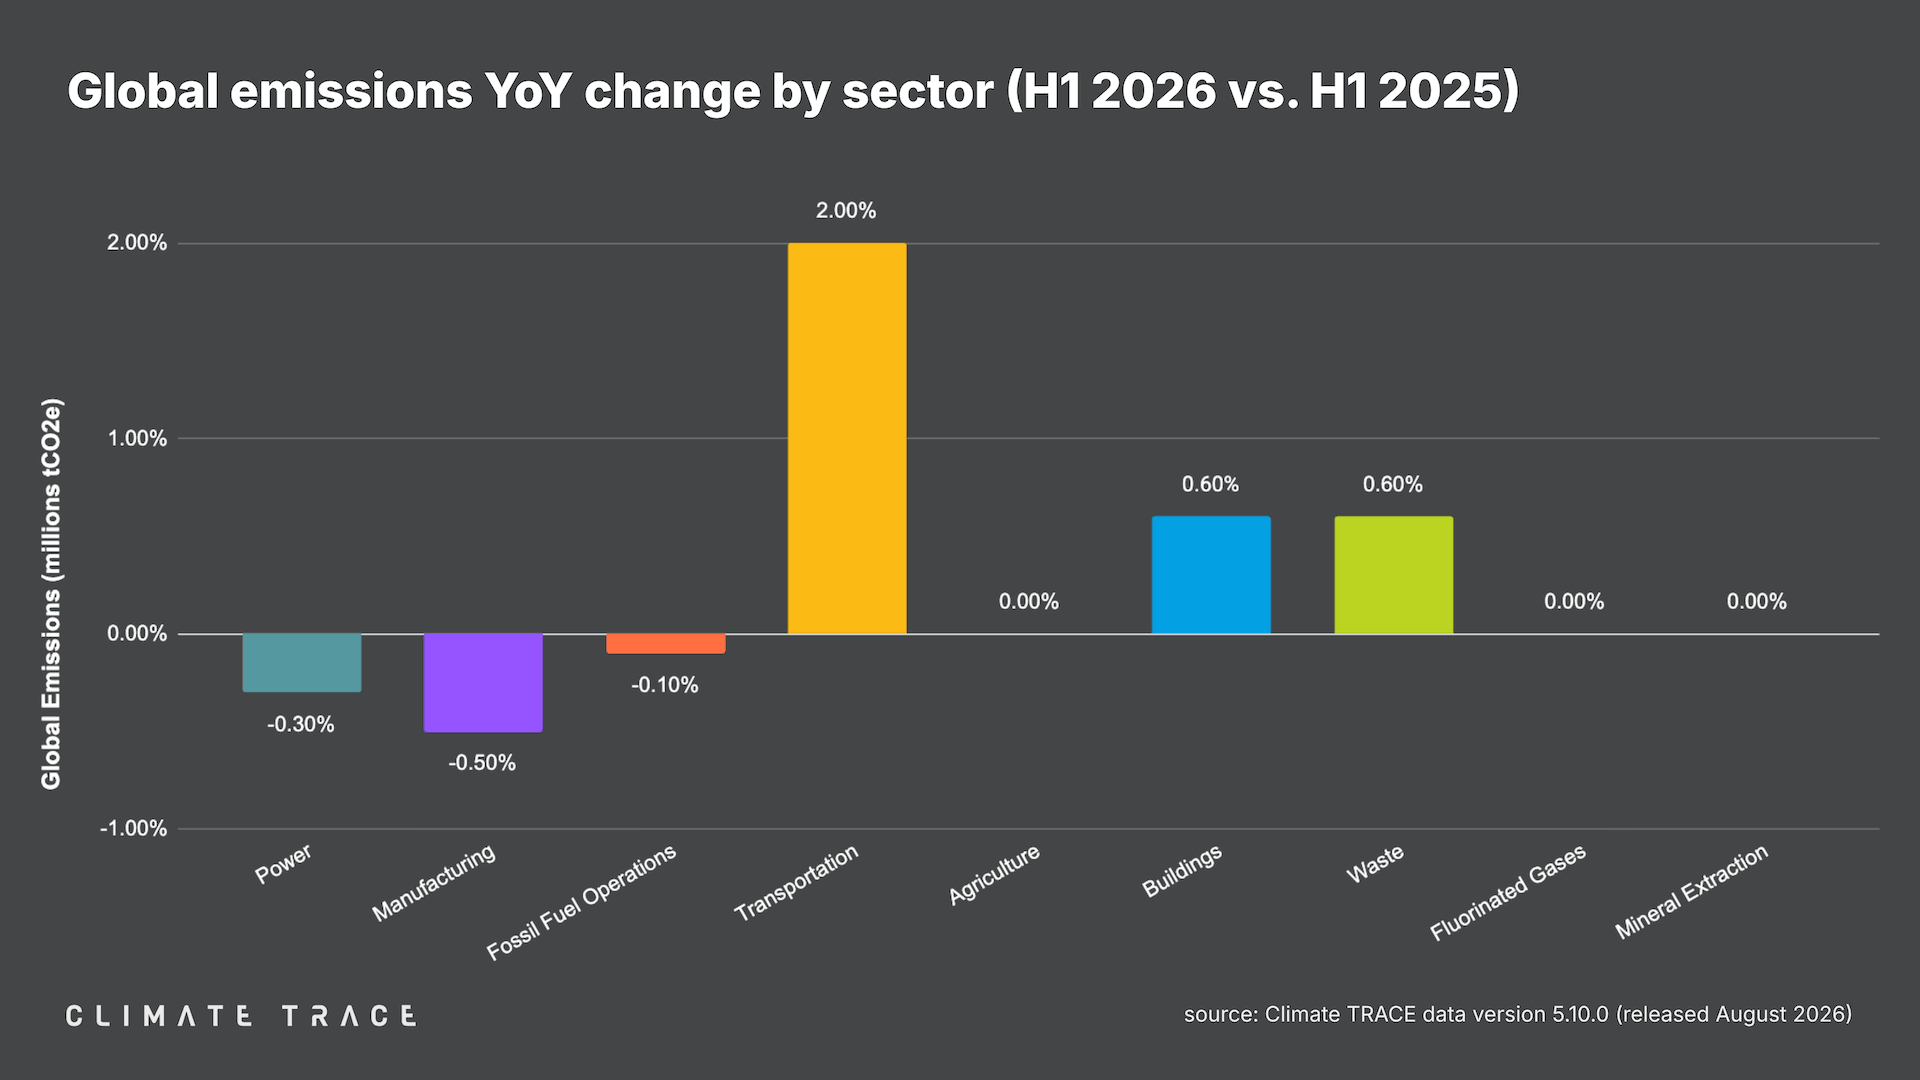
Transportation was the largest source of emissions growth in the first half of 2026, driven primarily by road transportation, which increased by 68.3 million tonnes of CO₂e or 2.0% compared to 2025's year-to-date emissions. This rise in emissions is reflective of higher activity in road transportation across numerous countries in the first half of 2026.
Global shipping emissions declined as the closure of the Strait of Hormuz disrupted maritime traffic.
Emissions from buildings and waste increased by an estimated 0.6% each. Meanwhile, manufacturing emissions declined by 30.1 million tonnes of CO₂e, or 0.5%, and power generation emissions fell by 22.9 million tonnes of CO₂e, or 0.3%, helping keep the overall increase in global emissions small.
China and US Emissions Fell Slightly, While India's Emissions Increased
The two countries with the highest emissions in the world --- China and the U.S. --- both saw slight declines in the first half of 2026. Emissions declined by 25.4 million tonnes of CO₂e, or 0.3%, in China and declined 15.0 million tonnes of CO₂e, or 0.4%, in the United States.
India, the world's third largest source of GHGs, recorded the largest increase in total emissions, rising by 30.6 million tonnes of CO₂e, or 1.5%. Brazil's emissions increased by 9.4 million tonnes of CO₂e, or 1.6%, and Vietnam's emissions rose 2.7%, or 7.3 million tonnes of CO₂e in the first half of 2026.
Energy Market Chaos Did Not Lead to a Spike in Power Emissions
According to Climate TRACE's preliminary analysis, the disruptions in energy markets in the first half of 2026 --- particularly for oil and gas --- did not lead to an increase in emissions from the power sector, indicating that there was not a major short-term shift to coal-fired power. Climate TRACE data show that in the first half of 2026, emissions from predominantly coal-fired assets fell by 33.5 million tonnes of CO₂e, or 0.7% compared with the same period in 2025, while emissions from predominantly gas-fired assets increased 10.9 million tonnes CO₂e, or 0.7%.
Overall, there was a net decline of 22.9 million tonnes of CO₂e or 0.3% from electricity generation. The rest of the emissions decline is likely attributable to the growing role of renewables. Ember data in the first half of 2026 show that renewable generation grew 7.7% year over year. Renewables' market share of total generation gained 1.5% while the share of coal and gas fell by 1.3% and 0.6%, respectively.
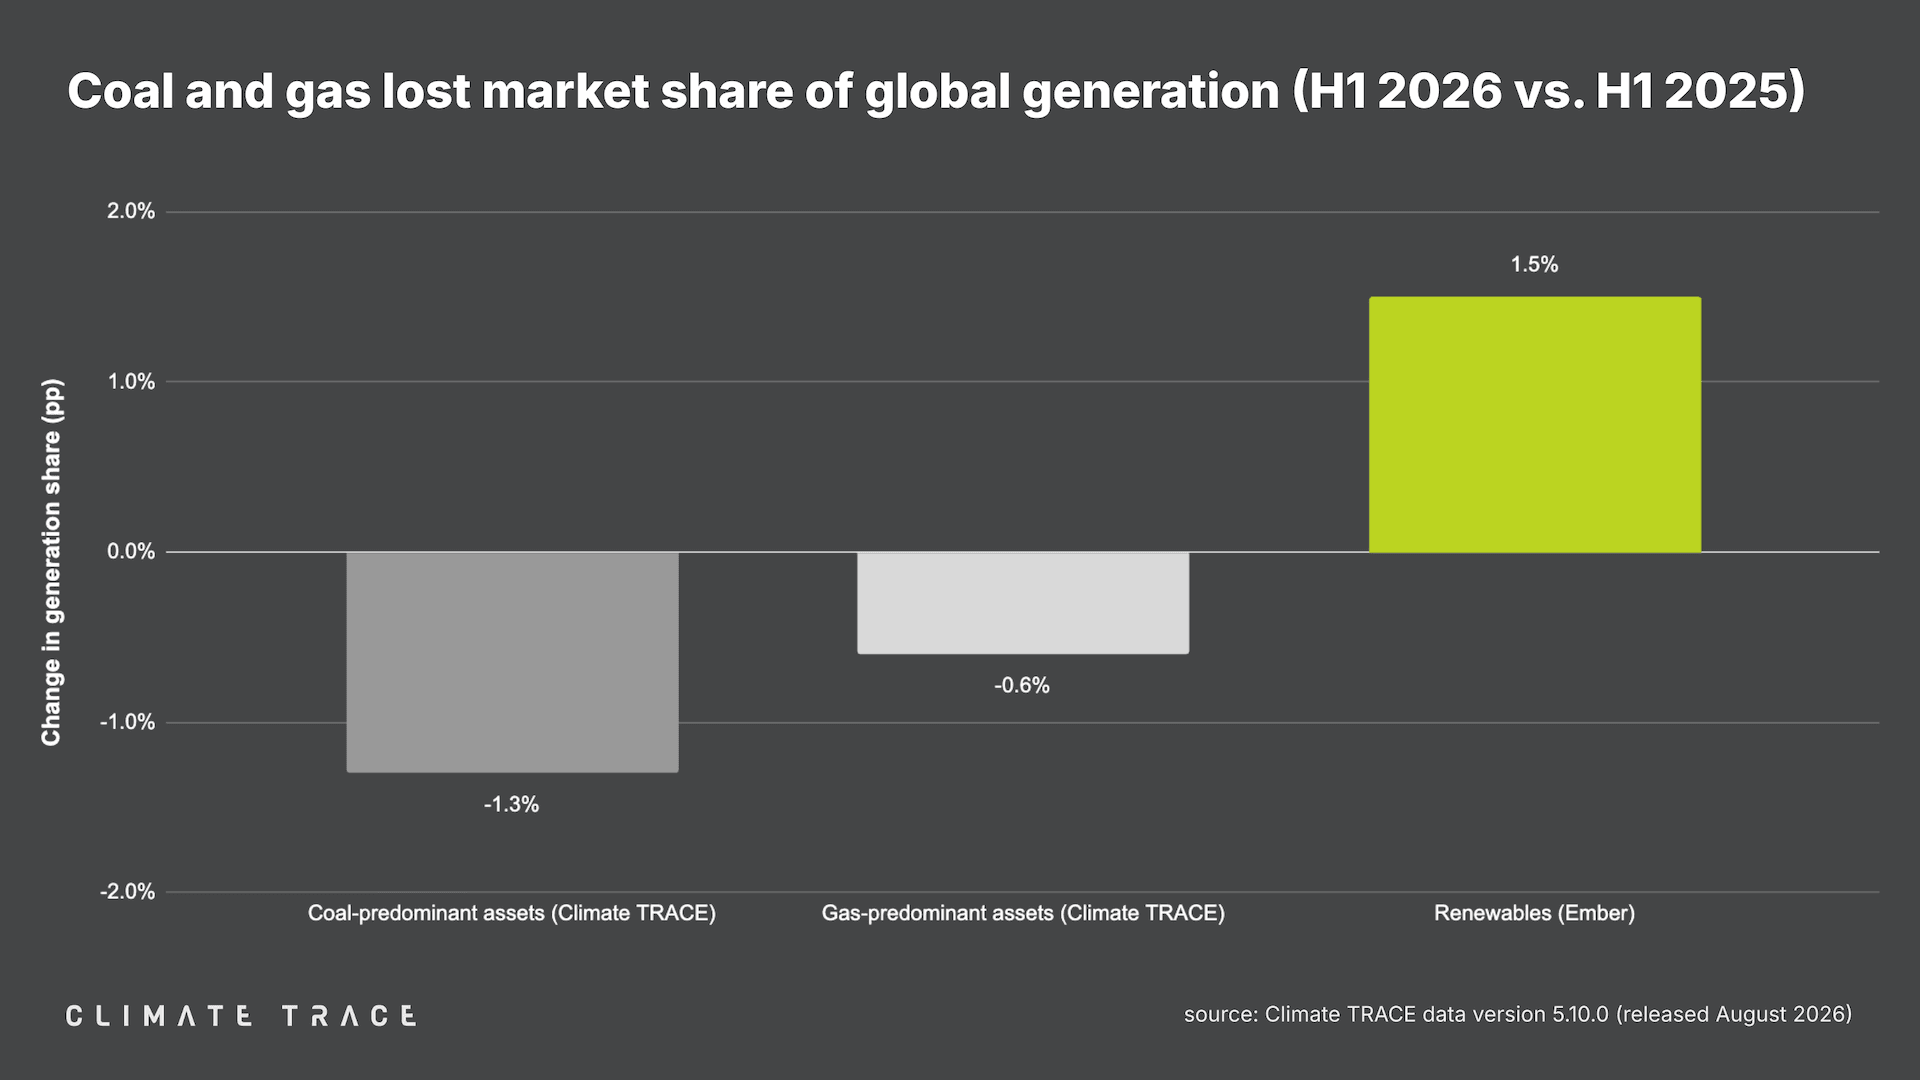 Sources: Climate TRACE (fossil, assets grouped by dominant fuel), Ember (renewables). Total generation is based on Ember estimates, while coal and gas generation reflects known power assets tracked by Climate TRACE.
June 2026 Summary
Global GHG emissions in the month of June 2026 totaled 4.9 billion tonnes CO₂e. This represents an increase of 0.6% vs. June 2025. Global methane emissions in June 2026 were 30.2 million tonnes CH₄, an increase of 0.1% vs. June 2025. Data tables summarizing GHG and primary particulate matter (PM2.5) emissions totals by sector, country, and the top 100 urban areas for June 2026 are available for download here.
Greenhouse Gas Emissions by Country: June 2026
Climate TRACE's preliminary estimate of June 2026 emissions in China, the world's top emitting country, is 1.5 billion tonnes CO₂e, a decline of 3.1 million tonnes of CO₂e, or 0.2% vs. June 2025.
Of the other top five emitting countries:
-
United States emissions declined by 8.7 million tonnes CO₂e, or 1.5% year over year;
-
India emissions increased by 17.0 million tonnes CO₂e, or 5.0% year over year;
-
Russia emissions increased by 0.1 million tonnes CO₂e, or unchanged year over year;
-
Indonesia emissions increased by 0.6 million tonnes CO₂e, or 0.5% year over year.
In the EU, which as a bloc would be the fourth largest source of emissions in June 2026, emissions increased by 5.7 million tonnes CO₂e compared to June 2025, or 2.0%.
Data on all other countries and territories are available in our Country/Territory Inventory.
Greenhouse Gas Emissions by Sector: June 2026
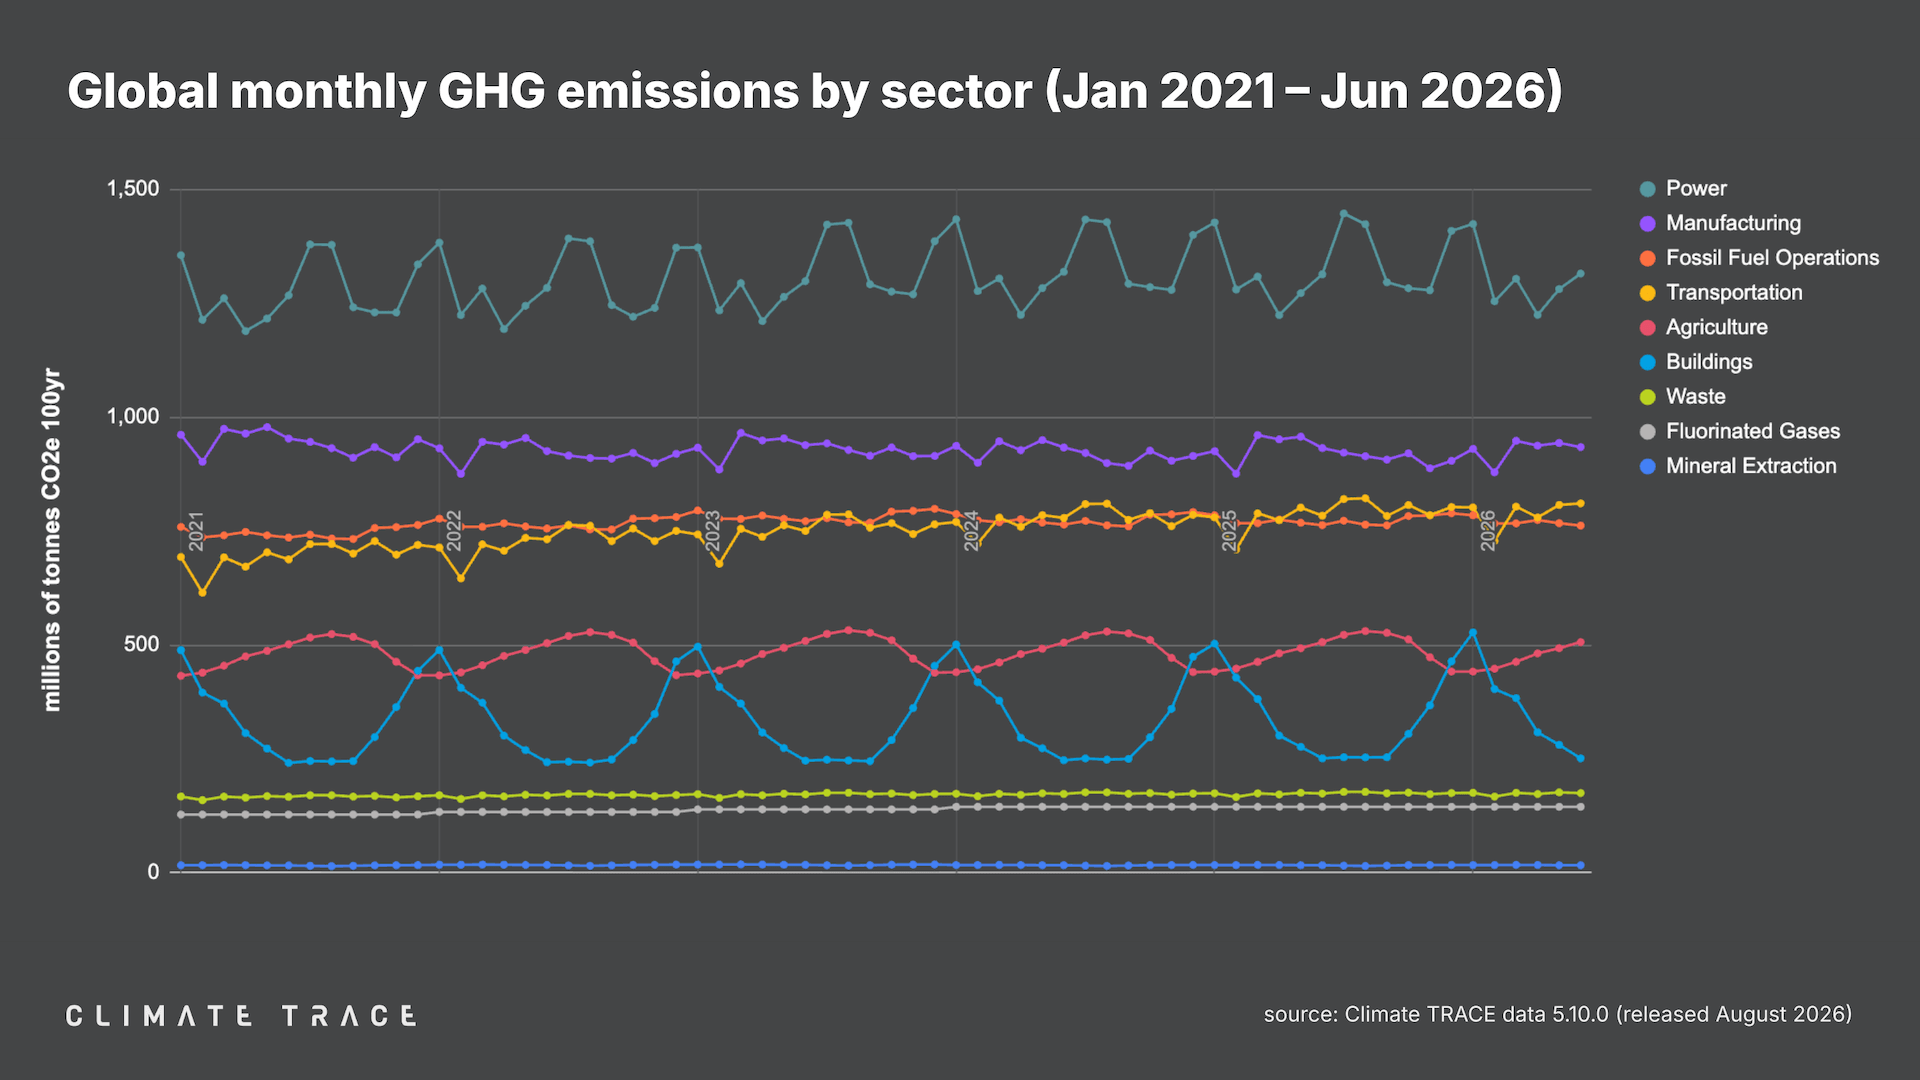
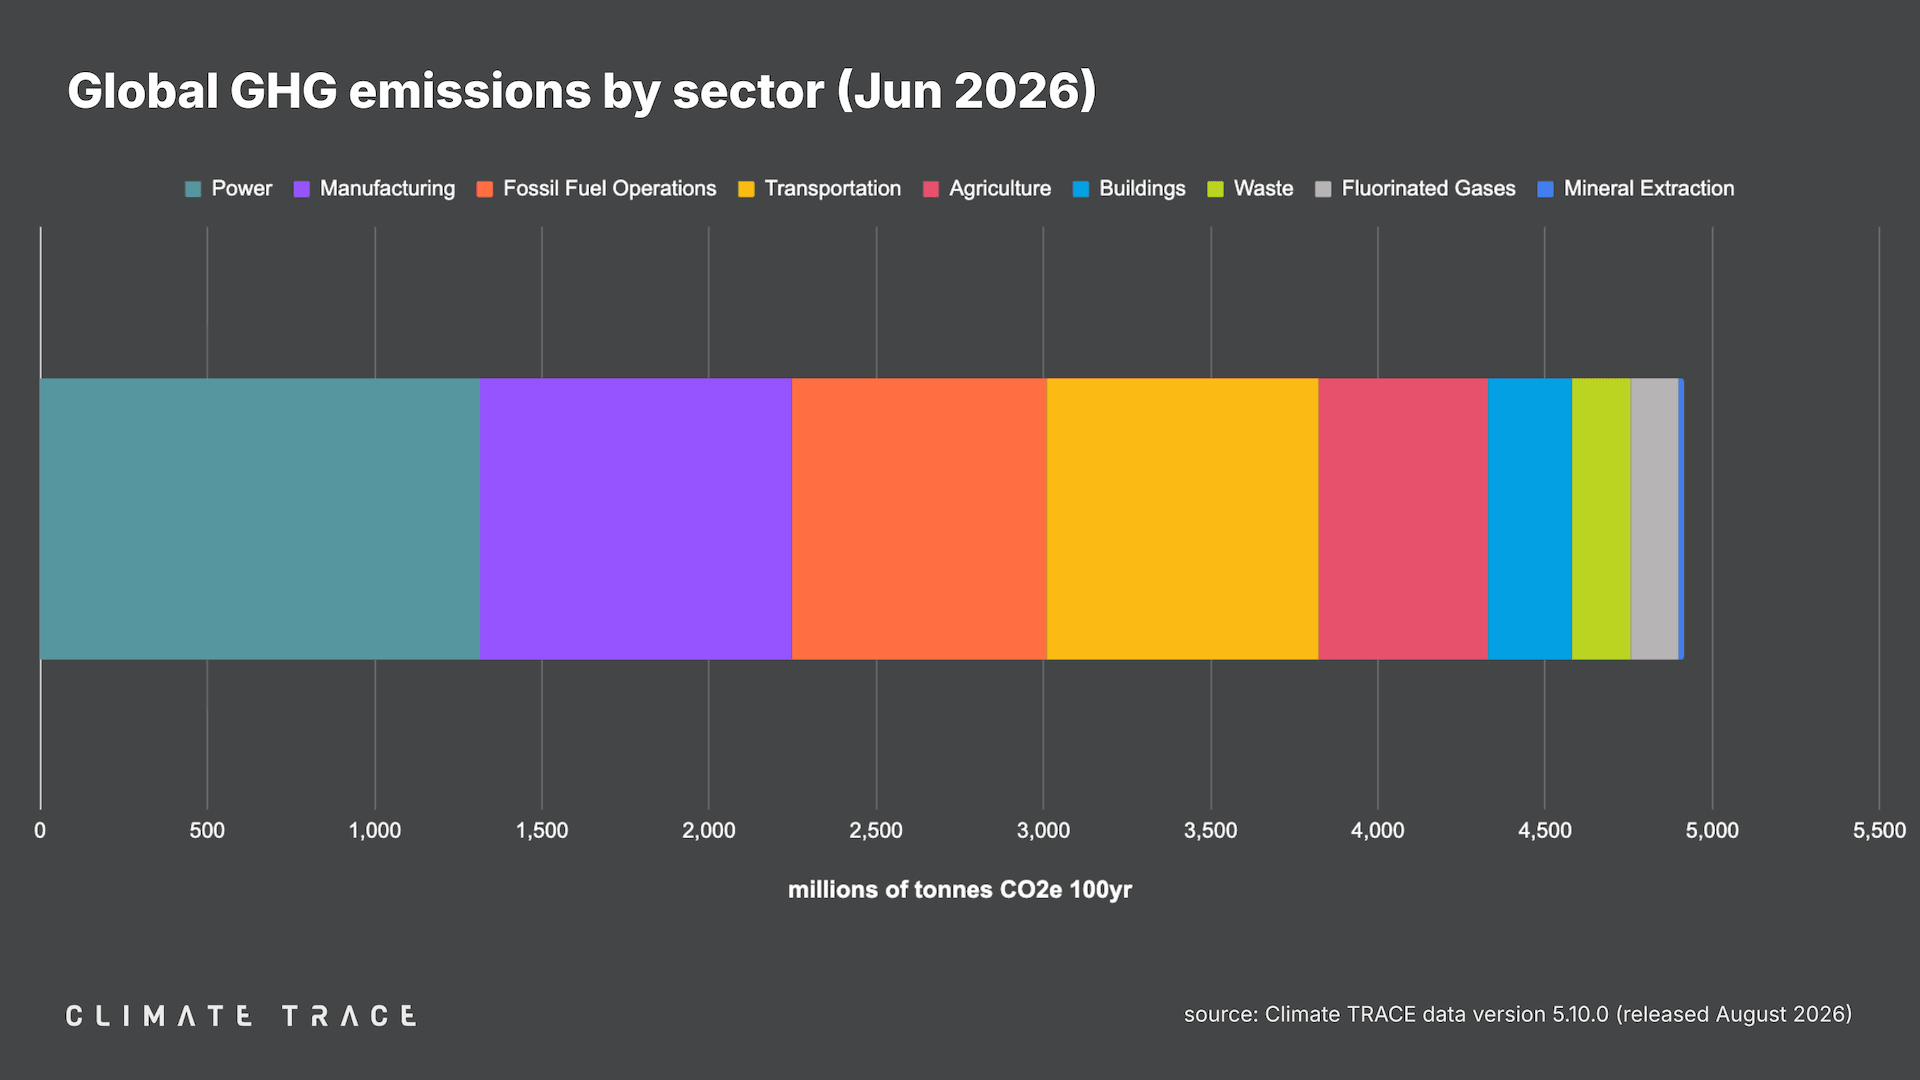
Greenhouse gas emissions increased in June 2026 vs. June 2025 in agriculture, manufacturing, power, transportation, and waste, and decreased in fossil fuel operations. Transportation saw the greatest change in emissions year over year, with emissions increasing by 3.4% as compared to June 2025.
-
Agriculture emissions were 506.4 million tonnes CO₂e, unchanged vs. June 2025;
-
Buildings emissions were 251.3 million tonnes CO₂e, unchanged vs. June 2025;
-
Fluorinated gases emissions were 145.0 million tonnes CO₂e, unchanged vs. June 2025;
-
Fossil fuel operations emissions were 761.9 million tonnes CO₂e, a 0.1% decrease vs. June 2025;
-
Manufacturing emissions were 934.0 million tonnes CO₂e, a 0.2% increase vs. June 2025;
-
Mineral extraction emissions were 16.8 million tonnes CO₂e, unchanged vs. June 2025;
-
Power emissions were 1,314.8 million tonnes CO₂e, a 0.1% increase vs. June 2025;
-
Transportation emissions were 810.6 million tonnes CO₂e, a 3.4% increase vs. June 2025;
-
Waste emissions were 175.0 million tonnes CO₂e, a 0.6% increase vs. June 2025.
Greenhouse Gas Emissions by City: June 2026
The urban areas with the highest total GHG emissions in June 2026 were Shanghai, China; Tokyo, Japan; Houston, United States; New York, United States; and Los Angeles, United States.
The urban areas with the greatest increases in absolute emissions in June 2026 as compared to June 2025 were Yuxi, China; Cologne, Germany; Wuhan, China; Obra, India; and Izumi-machi Kurosuno, Japan. Those with the largest absolute emissions declines between this June and last June were Lanshan, China; Detroit, United States; Dubai, United Arab Emirates; Nagoya, Japan; and Manama, Bahrain.
The urban areas with the greatest increases in emissions as a percentage of their total emissions were Sobral, Brazil; Coronel, Chile; Yuxi, China; San Pedro de Macorís, Dominican Republic; and Lakheri, India. Those with the greatest decreases by percentage were Xihe, China; Lufeng, China; Yenakiieve, Ukraine; Sault Ste. Marie, Canada; and Nimbahera, India.
RELEASE NOTES Revisions to existing Climate TRACE data are common and expected. They allow us to take the most up-to-date and accurate information into account. As new information becomes available, Climate TRACE will update its emissions totals (which could include historical estimates) to reflect new data inputs, methodologies, and revisions.
With the addition of June 2026 data, the Climate TRACE database is now updated to version V5.10.0. This release includes the addition of a new subsector: net soil organic carbon. Climate TRACE calculates emissions in this sector using the System Approach for Land Use Sustainability (SALUS) method. This approach estimates annual changes in soil organic carbon stocks and the associated sinks or sources across global cropland.
Additionally, this update includes major methodological updates across multiple sectors: agriculture, fossil fuel operations, manufacturing, power, transportation, and waste.
-
In agriculture, the pasture sectors updated activity estimates to account for seasonality using gross primary production layers, and the cattle operations sectors revised the N₂O and CH₄ emission factors.
-
For fossil fuel operations, the coal mining sector now includes emissions data from fuel combustion activities and rock acidification, which were previously reported under other fossil fuel operations.
-
Within manufacturing, the aluminium sector updated its emission factors.
-
In the power sector, 21 new data sources containing reported power plant activity were used to update emissions estimates.
-
In transportation, non-broadcasting vessels now use the S1 detection dataset, and road transportation corrected its PM2.5 emissions estimates using data from the United Nations Economic Commission for Europe statistical database and various country-level inventories.
-
In waste, the domestic wastewater sector added 8,019 new assets, with particularly expanded coverage in the Philippines.
A detailed description of data updates is available in our changelog here.
To learn more about what is included in our monthly data releases and for frequently asked questions, click here.
All methodologies for Climate TRACE data estimates are available to view and download here.
For any further technical questions about data updates, please contact: coalition@ClimateTRACE.org.
To sign up for monthly updates from Climate TRACE, click here.
Emissions data for July 2026 are scheduled for release on September 24, 2026.
About Climate TRACE The Climate TRACE coalition was formed by a group of AI specialists, data scientists, researchers, and nongovernmental organizations. Current members include Carbon Yield; Carnegie Mellon University's CREATE Lab; CTrees; Duke University's Nicholas Institute for Energy, Environment & Sustainability; Earth Genome; Former Vice President Al Gore; Global Energy Monitor; Global Fishing Watch/emLab; Johns Hopkins University Applied Physics Lab; OceanMind; RMI; TransitionZero; and WattTime. Climate TRACE is also supported by more than 100 other contributing organizations and researchers, including key data and analysis contributors: Arboretica, Michigan State University, Ode Partners, Open Supply Hub, Saint Louis University's Remote Sensing Lab, and University of Malaysia Terengganu. For more information about the coalition and a list of contributors, click here.
Media Contacts Fae Jencks and Nikki Arnone for Climate TRACE